Graph area – HP Hub & Switch Management for OV-UX User Manual
Page 48

7-2
Managing Switches
Switch Status
M
a
nagi
ng S
w
it
ches
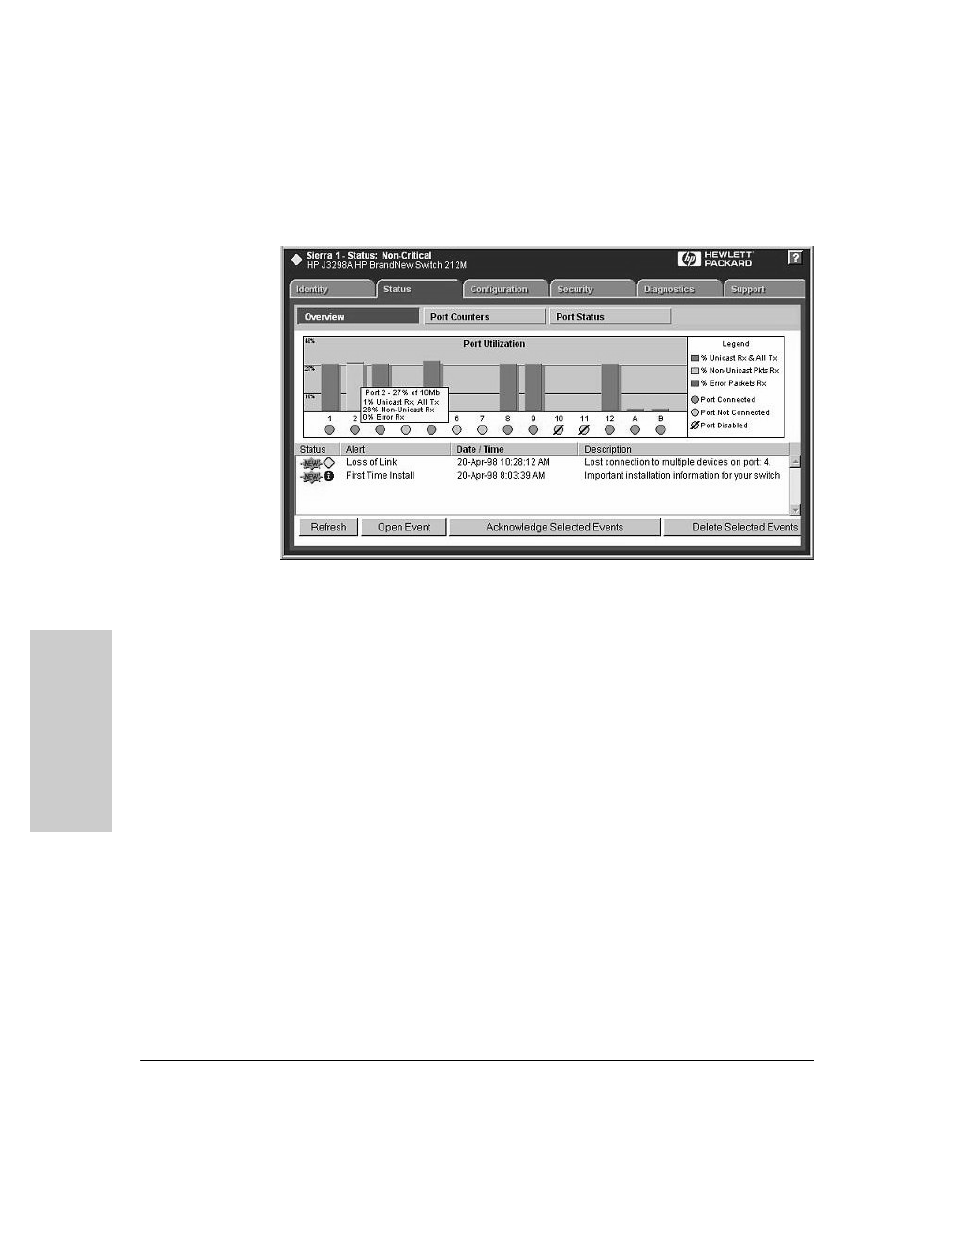
Figure 7-1. Switch Status Overview Page
Graph Area
The bar graph gives a quick overview of the performance of the switch. Each
bar shows the highest percentage of transmitted (TX) or received (RX)
traffic utilization for that port in the last five seconds.
The graph area proportionally depicts three attributes for each port:
■
Unicast packets - The percent utilization for packets that were not
addressed to a multicast or broadcast address.
■
Non-Unicast packets - The percent utilization of received non-unicast
packets (both broadcast and multicast). If there is a broadcast storm, only
the port receiving these packets shows high utilization, letting you quickly
pinpoint the problem.
■
Errors - The percent utilization for error packets received. A high
percentage may indicate possible network problems.
Place the cursor over a bar in the graph to display the exact percentages for
each attribute and the speed of that port. The above graph displays a high
percentage of non-unicast packets on port 2 (a 10 Mbps port) because this
port is running video. Port 5 is indicating some errors.
- Scripting Toolkit for Linux (68 pages)
- Scripting Toolkit for Windows 9.50 (62 pages)
- Scripting Toolkit for Windows 9.60 (62 pages)
- Storage Area Manager (13 pages)
- Core HP-UX (5 pages)
- Matrix Operating Environment Software (71 pages)
- Matrix Operating Environment Software (107 pages)
- Matrix Operating Environment Software (239 pages)
- Matrix Operating Environment Software (77 pages)
- Insight Management-Software (148 pages)
- Matrix Operating Environment Software (80 pages)
- Insight Management-Software (128 pages)
- Matrix Operating Environment Software (132 pages)
- Matrix Operating Environment Software (74 pages)
- Matrix Operating Environment Software (76 pages)
- Matrix Operating Environment Software (233 pages)
- Matrix Operating Environment Software (61 pages)
- Matrix Operating Environment Software (232 pages)
- Matrix Operating Environment Software (70 pages)
- Matrix Operating Environment Software (120 pages)
- Matrix Operating Environment Software (36 pages)
- Matrix Operating Environment Software (99 pages)
- Matrix Operating Environment Software (192 pages)
- Matrix Operating Environment Software (198 pages)
- Matrix Operating Environment Software (66 pages)
- Matrix Operating Environment Software (95 pages)
- Matrix Operating Environment Software (152 pages)
- Matrix Operating Environment Software (264 pages)
- Matrix Operating Environment Software (137 pages)
- Matrix Operating Environment Software (138 pages)
- Matrix Operating Environment Software (97 pages)
- Matrix Operating Environment Software (33 pages)
- Matrix Operating Environment Software (142 pages)
- Matrix Operating Environment Software (189 pages)
- Matrix Operating Environment Software (58 pages)
- Matrix Operating Environment Software (79 pages)
- Matrix Operating Environment Software (68 pages)
- Matrix Operating Environment Software (223 pages)
- Matrix Operating Environment Software (136 pages)
- Matrix Operating Environment Software (34 pages)
- Matrix Operating Environment Software (63 pages)
- Matrix Operating Environment Software (67 pages)
- Matrix Operating Environment Software (104 pages)
- Matrix Operating Environment Software (128 pages)
- Matrix Operating Environment Software (75 pages)
