Setra System Model 869 User Manual
Page 13
44
12.0 SPECIFICATION DERIVATIONS
Total Error Band
(Worst case) over a temperature range of
-10°F to +130°F
Non Linearity:
±0.1% FS
Hysteresis:
±0.05% FS
Non-Repeatability:
±0.02% FS
Thermal Zero Shift:
< ±0.32% FS
Thermal Span Shift:
< ±0.24% FS
Zero Offset:
±0.2% FS
Span Offset:
±0.2% FS
±1.13% FS
Long-term stability error not included.
13
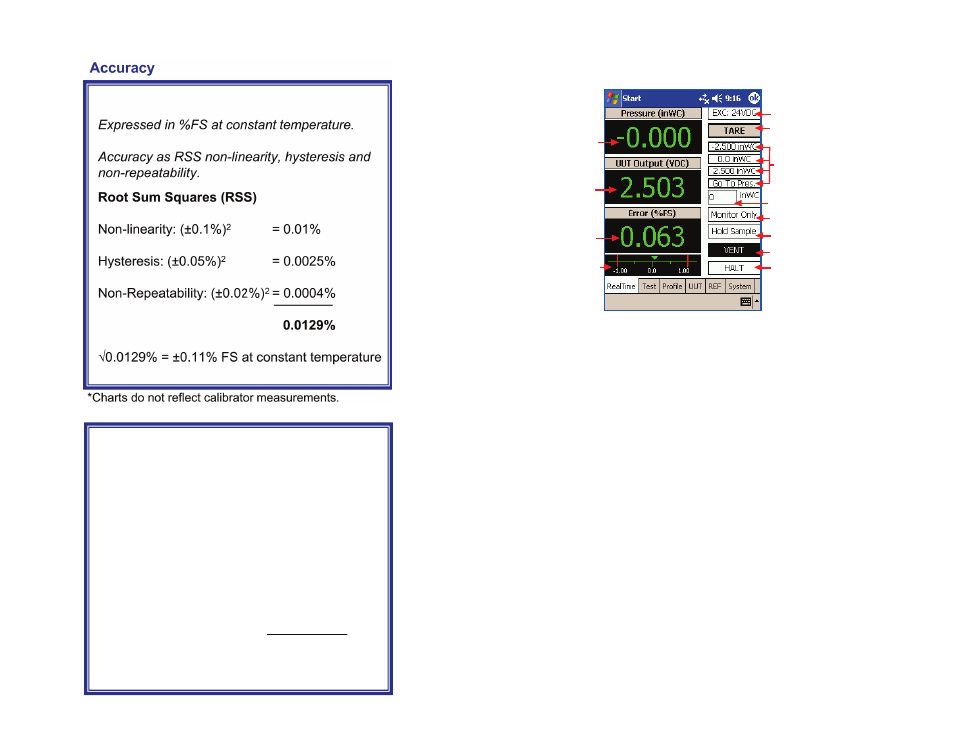
the present range of the graph. The arrow showing the error will turn red
when the error is outside of tolerance.
6.21 REAL TIME: Dial Gauge
Differences from General (Diagram 7):
-Output and Error windows hidden.
-Bar Graph of Error is hidden.
6.22 REAL TIME: P-Switch
Differences from General (Diagram 7):
-Output window changes to OPEN/CLOSE indicator.
-Error window changes to OPEN/CLOSE capture window
-Bar Graph of Error is hidden.
6.23 REAL TIME: Expert System
Differences from General (Diagram 7):
-Monitor Only/Control button locked out, automatically controlled by the
process head connection/disconnection.
Diagram 7
Excitation to Unit UnderTest (UUT)
Tares Internal Pressure Standard
Applied Pressure
UUT Output
Terminal Based
Error (%FS)
Includes Zero
and Span Errors
Bar Graph of
Error (%FS)
Snapshot of Any
Displayed Condition
Vents Pressure to Atmosphere
Halts Operation
Monitor Mode
Current Pressure Target
Go To Pressure Macro buttons