Setra System Model 869 User Manual
Page 12
12
6.0 POCKET PC INTERFACE SCREENS
The Pocket PC Interface is tab-based, split into 6 major sections at the
bottom of the screen.
6.1 APPLICATION DEFINITIONS
General: This describes operation for the broadest range of applications.
Dial Gauge: Departures from general operation for Dial Gauge calibration.
P-Switch: Departures from general operation for Pressure Switch calibration.
Expert System: Departures from general operation for Expert System
calibration.
6.2 REAL TIME: General
Screen Instructions (Diagram 7):
Real Time page is constantly updating and is used to see the output and
pressure being applied for calibration purposes and test purposes (acts as
a digital indicator).
Applied Pressure Window: Displays system pressure. When “Go To
Pres.” is pushed, the text will turn yellow while pressure is outside of tar-
get control band. (Required control stability for UUT.) Text will turn green
when target pressure is reached.
Go to Pressure macro buttons are configured by UUT pressure range.
For all units, the top most button will display the UUT’s lowest Input Pres-
sure. The bottom-most button will display the UUT’s highest input pres-
sure. The middle button will display “0.0” for bidirectional units, and 50%
FS (Full Scale) of UUT range for unidirectional units.
Pressing any of the buttons enters the pressure value on the button into
the target pressure window and calls the “Go to Pressure” function.
HOLD SAMPLE: Will take a filtered reading and freeze the display with
that reading. To release, press the same button - Release Hold.
VENT: Opens both positive and negative pressure ports to each other
and atmosphere.
TARE: Zeros out internal pressure standard and re-zero’s mechanical
components in controller.
GO TO PRESSURE: Calls controller to generate pressure point set in
pressure target box.
HALT: Stops any process in action.
MONITOR/CONTROL: Switches calibrator into monitoring mode. This
allows calibrator to be used as pressure measurement device.
Error Graph is an auto-scaling display of the present error of the UUT’s
output as compared to the applied pressure. The red bars on the graph
represent the UUT’s accuracy specification limits. The labels will display
Excitation to Unit UnderTest (UUT)
Tares Internal Pressure Standard
Applied Pressure
UUT Output
Terminal Based
Error (%FS)
Includes Zero
and Span Errors
Bar Graph of
Error (%FS)
Snapshot of Any
Displayed Condition
Vents Pressure to Atmosphere
Halts Operation
Monitor Mode
Current Pressure Target
Go To Pressure Macro buttons
45
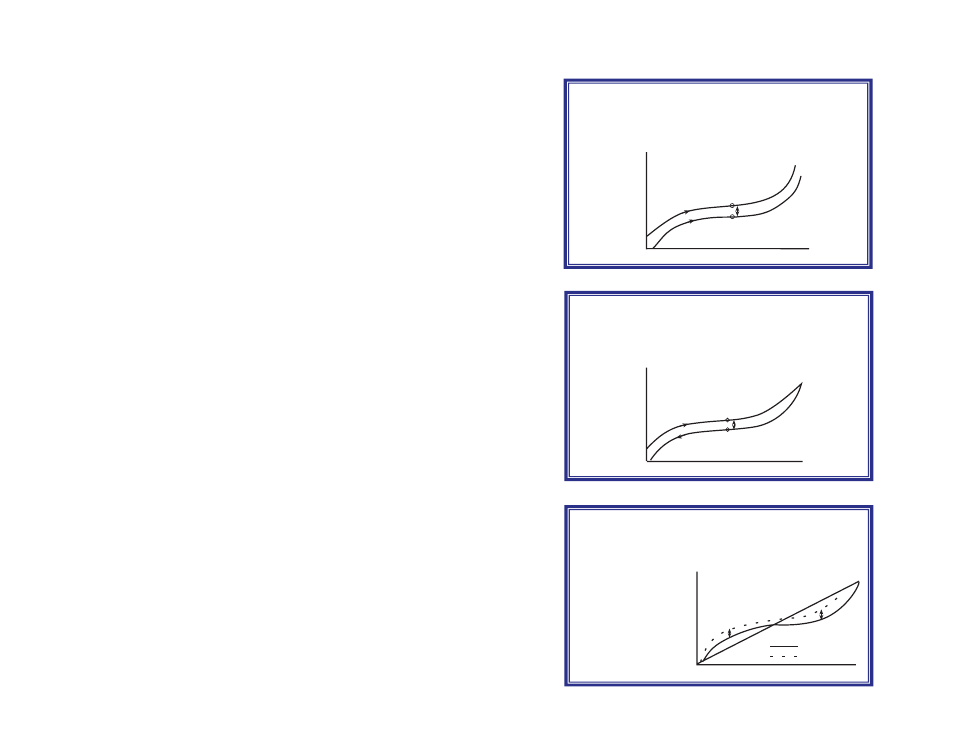
Hysteresis
Non-Repeatability
The ability of a transducer to reproduce output
readings when the same pressure value is
applied to it consecutively, under the same
conditions, and from the same direction.
5 VDC
0 VDC
0 PSI
100 PSI
<0.02%FS
The maximum difference in output at any
pressure value within the specified range, when
the value is approached with increasing and
decreasing pressure.
5 VDC
0 VDC
0 PSI
100 PSI
<0.05%FS
Long-Term Stability
The ability of a transducer to reproduce output
readings obtained during its original calibration
at room conditions for a specified period of time.
5 VDC
0 VDC
0 PSI
100 PSI
+0.1
% F
S
Example: ±0.1% FS
Over 6 Months at
70°F (21°C)
-0.1
% F
S
Original Calibration
After 6 Months