Diagram 5a, Diagram 5b, Non-linearity – Setra System Model 869 User Manual
Page 10
10
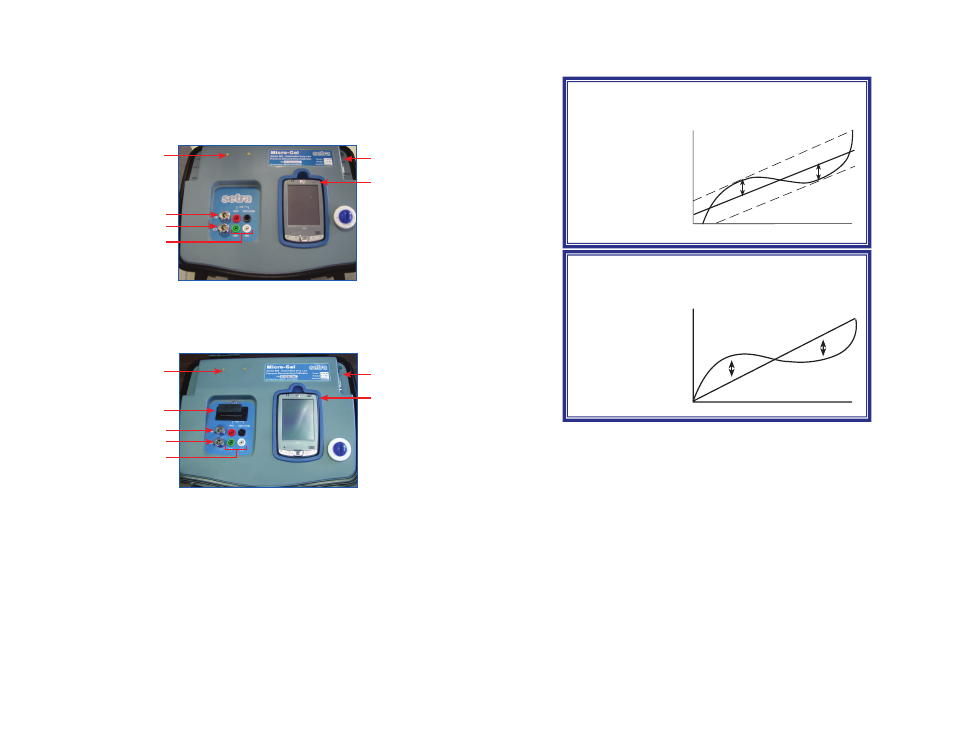
5.3 USER INTERFACE PANEL
The user interface panel includes the pressure and electrical connections
to the unit under test. (See Diagrams 5A & 5B.)
Diagram 5A
Power Switch
Pocket PC
Power Switch
Low Pressure Port
High Pressure Port
Optional UUT Mounting
8-32 UNF Threaded Inserts (2)
Electrical Connections
for Unit Under Test
Expert-Equipped 869
Standard 869
EPIC Connection Point
Power Switch
Pocket PC
Power Switch
Low Pressure Port
High Pressure Port
Optional UUT Mounting
8-32 UNF Threaded Inserts (2)
Electrical Connections
for Unit Under Test
Diagram 5B
47
Non-Linearity
Relationship of a calibration curve to a specified
straight line.
Best Fit
Straight Line
(BFSL)
Method
Example: ±0.1% FS
Relationship of a calibration curve to a specified
straight line with end points at zero and full scale.
Terminal
Method
Example: ±0.12%
FS
5.1 VDC
0.1 VDC
0 PSI
100 PSI
+0.
1%
FS
-0.1
%FS
R
S
232 OU
TP
U
T
0 PSI
100 PSI
+0.
012
%F
-0.0
12%
- Model ASM (8 pages)
- Model 204 (4 pages)
- Model 209 (4 pages)
- Model 227 (8 pages)
- 264 (4 pages)
- 269 (4 pages)
- Model 280E (4 pages)
- Model 370 (48 pages)
- Model 526 (7 pages)
- Model 540 (9 pages)
- Model 595 (8 pages)
- Model 321 (4 pages)
- Model SRH (12 pages)
- Model Datum 2000 (31 pages)
- Model 217 (8 pages)
- Model 230 (12 pages)
- Model 242901-06 (1 page)
- Model 265 (4 pages)
- Model 270 (5 pages)
- Model 299 (4 pages)
- Model 470 (35 pages)
- Model 524 (6 pages)
- Model 546 (8 pages)
- Model 730 (16 pages)
- GCT-225 (8 pages)
- Model 141 (4 pages)
- Model 205-2 (4 pages)
- Model 223 (8 pages)
- Model 231 (12 pages)
- Model 256 (8 pages)
- Model 276 (2 pages)
- Model 3100 (8 pages)
- Model 516 (6 pages)
- Model 550 (9 pages)
- Model 760 (18 pages)
- Model LD330 (4 pages)
- Model SRMD (8 pages)
- Model 201 (4 pages)
- Setra Model 206 (4 pages)
- Model 224 (8 pages)
- Model 231RS (16 pages)
- 260 (2 pages)
- 267MR (14 pages)
- Model 278 (2 pages)