Experiment 2: measuring a baseband waveform – GW Instek GRF-1300A User Manual
Page 38
GRF-1300A User Manual and Teaching Materials
Experiment 2: Measuring a Baseband Waveform
Relevant
information
Relative to oscilloscopes, spectrum analyzers have many
outstanding advantages. They are also the primary measurement
tool for measuring frequency domain data. Learning how to use
a spectrum analyzer is an essential skill that every student must
master to gain RF knowledge.
By measuring a baseband signal, this experiment allows
students to comprehensively understand how to operate a
spectrum analyzer and lays the foundation for subsequent
experiments.
Item Equipment
Quantity Note
1
Spectrum analyzer
1
GSP-730
2
RF & Communication
Trainer
1
GRF-1300A
3
RF wire
1
800mm
4
Adapter
1
N-SMA
Experiment
goals
1.
Measurement and analysis on a basic signal.
2.
To understand how to use the GRF-1300A system to output a
baseband signal.
Experiment
principles
Set the GRF-1300A to output a 1MHz sine waveform and
use the GSP-730 to measure its spectrum. The working principle
of a spectrum analyzer has been introduced in a previous
chapter. We won’t repeat it here.
Experiment
contents
Set and then measure the spectrum of a 1MHz sine wave.
Measure the harmonic ratio at each of the harmonic frequencies.
Experiment
steps
1.
Turn on the GRF-1300A and the GSP-730.
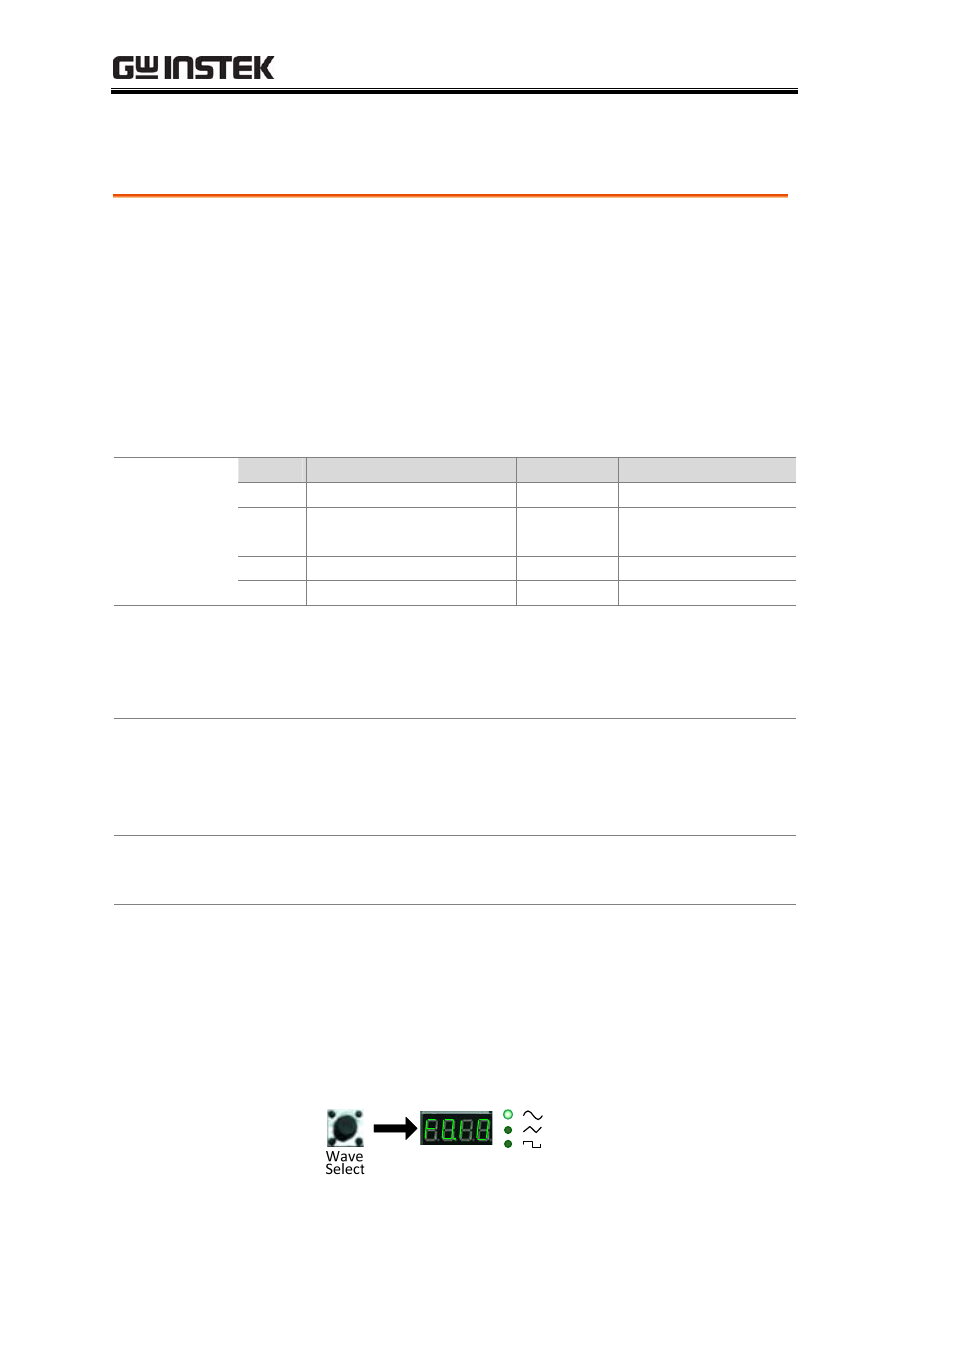
2.
Set the GRF-1300A baseband as follows:
• Waveform: Sine wave
• Frequency: 1MHz.
• Turn the amplitude knob clockwise to its end.
Step1
36