Overview of the time and frequency domain – GW Instek GRF-1300A User Manual
Page 19
Overview of the Time and Frequency Domain
from an oscilloscope and power (dBm) from a spectrum
analyzer. Voltage and power can be converted from one to the
other, so both of them can be used to display the strength of a
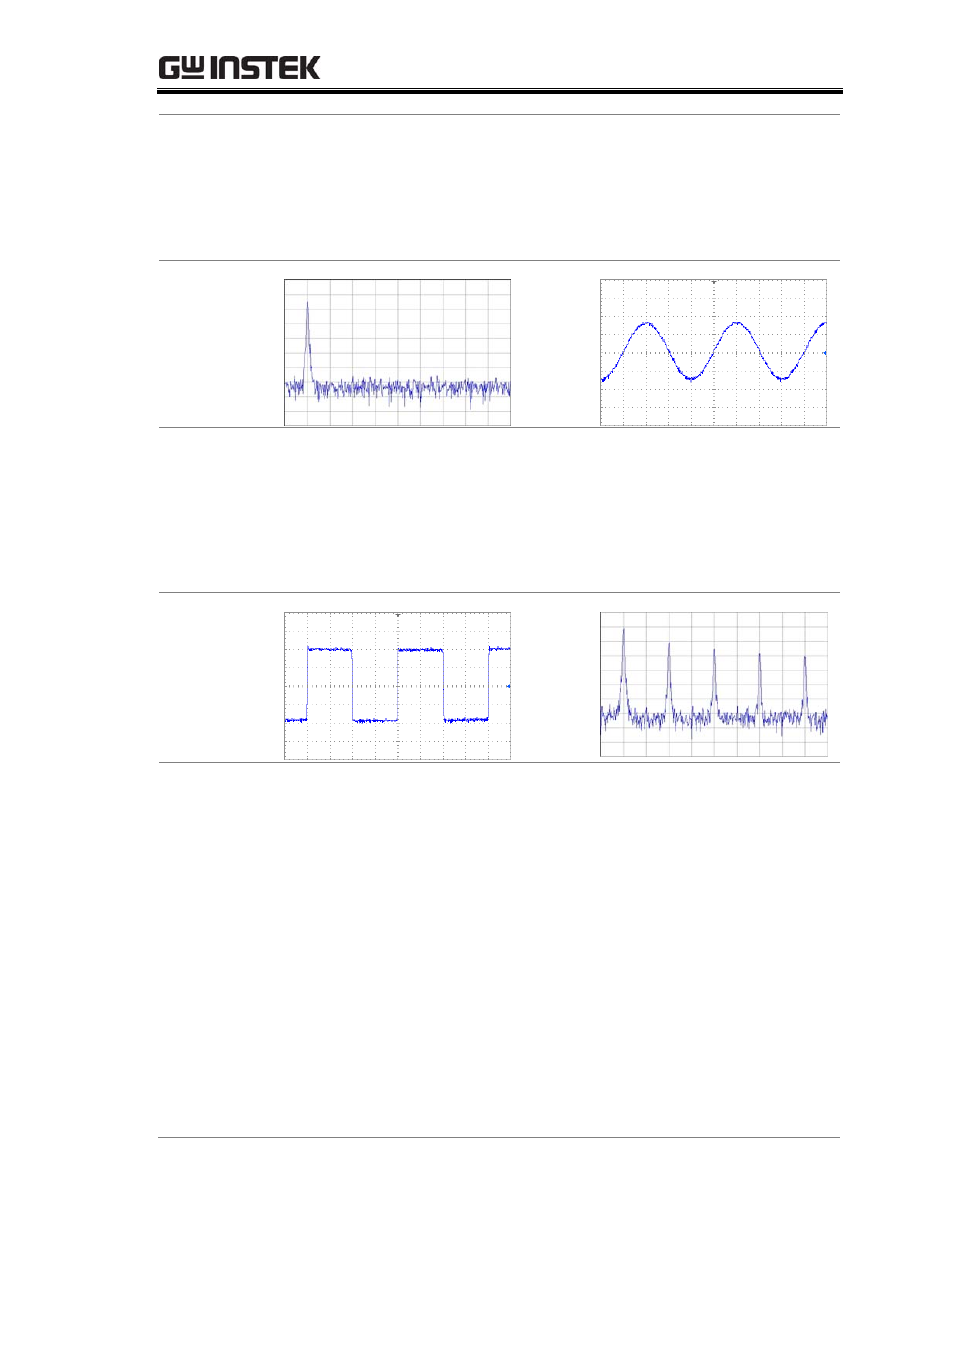
signal. Here we introduce a basic concept first. Each frequency
point in the spectrum represents a sinusoidal wave (could be a
sine or cosine) of a single frequency.
What about a square wave? We will now explain how a
square waveform and sine waveform are different to each other
in the frequency domain. If we input a square wave with a
period of 1 microsecond into a spectrum analyzer, its waveform
performance (we usually to say its spectrum or frequency
distribution) is as follows.
If we compare it with a sine wave spectrum, we can observe
that in addition to the point at the1MHz scale, other signal
points also appear at higher frequencies and with decreased
amplitudes. Therefore it shows that a square wave also includes
a combination of signals that are multiples of the frequency
baseband in addition to the 1MHz base frequency (fundamental
frequency).
We can see a classic relationship between the time domain
and frequency domain in the illustration below. A square wave
signal in the time domain can be decomposed into multiple
basic harmonic waves. The distribution of these harmonic
components can be clearly seen in the frequency domain.
Frequency domain analysis describes the characteristics of a
signal from another viewpoint.
17