10 graph scale setup, Graph scale setup -27 – Yokogawa YVP20S User Manual
Page 153
14-27
IM 21B04C50-01E
<14. DIAGNOSTIC SERVICES>
• Show Set Points
For Step Response Test only. Checking/Unchecking Show Set Points from a pop-up
menu will display or hide the set points curve in step response graph. The default mode
shows set points curve.
• Grid Line
Select a grid line figure from solid, dot, and none by clicking Grid Line from a pop-up menu.
• Zoom in/Zoom out
Zoom in: In the curve area of a graph window, a selected rectangle area by mouse will be
zoom in.
Zoom out: double clicking a mouse or select Zoom Out from pop-up menu will restore
current displaying scale setting to default.
• Signature Summary
Selecting a curve and clicking Measurement Summary from Pop-up menu will open
Signature Summary, Dialog to show signature measurement information. Refer to ‘14. 3. 12
Signature Summary’ for details.
• Signature Notes
Selecting a curve and clicking Signature Notes from Pop-up menu will display User’s
notes. This information is editable. Refer Signature Notes for details.
• Remove Curve
Selecting a curve and clicking Remove Curve from pop-up menu will delete the curve from
the graph.
14.3.10
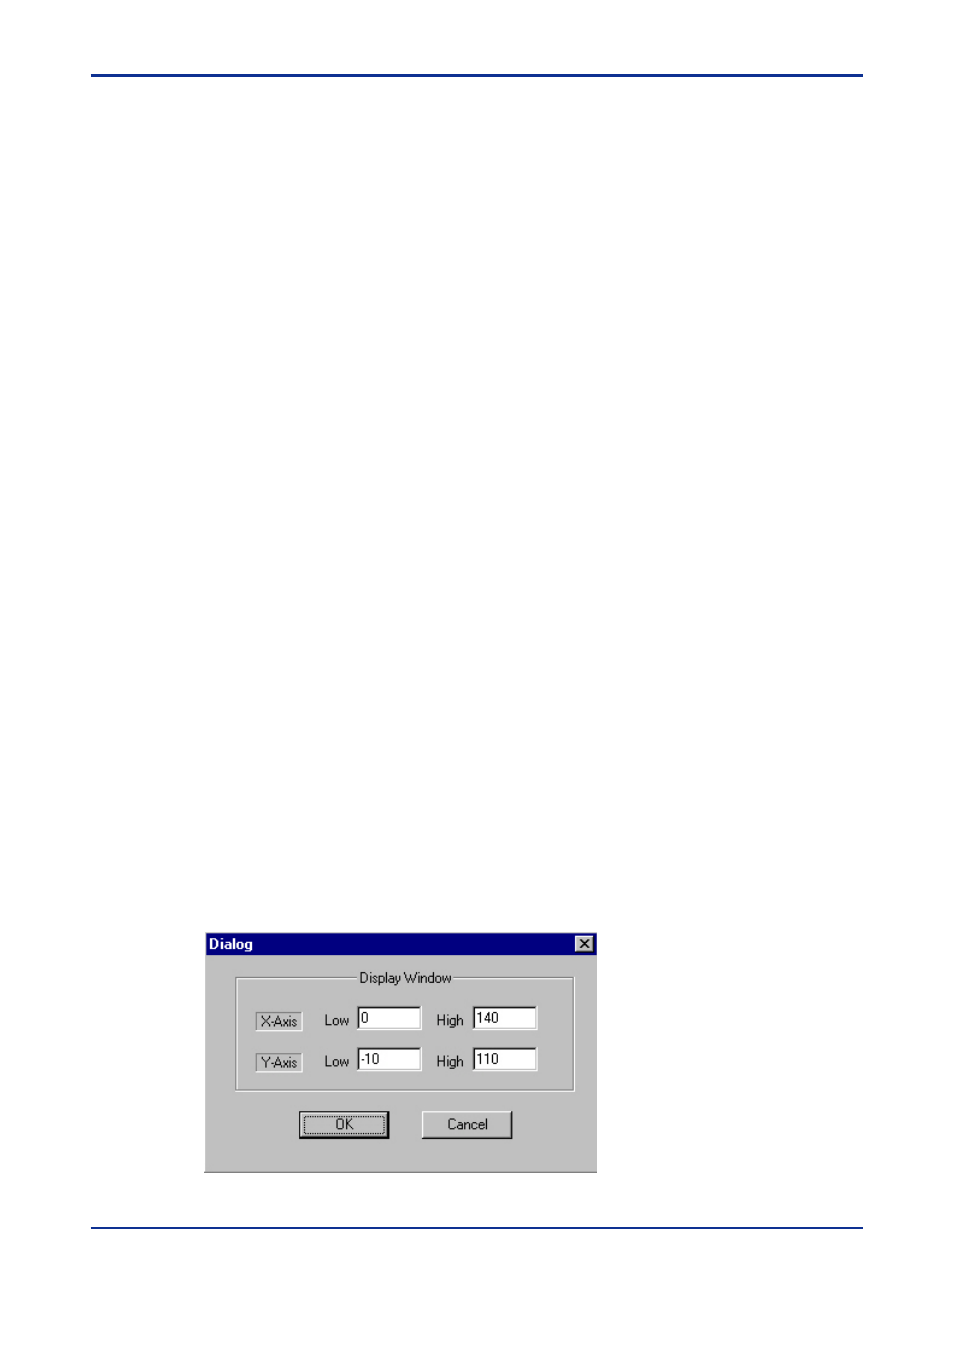
Graph Scale Setup
This dialog is used for setup signature graph windows display area.
X-Axis: display range of input parameter.
Y-Axis: display range of output parameter.
Figure 14.22 Scale setting