Temperature trend data, Overview, Displaying the temperature trend graph – ZOLL Thermogard XP IVTM System Operation Manual User Manual
Page 88
Operation
57
Temperature Trend Data
Overview
During operation, the System continuously collects and stores temperature trend
data, storing a record each minute. This data is stored in memory and can be
downloaded to an attached laptop computer for later analysis or plotting.
The memory will hold up to 21 days of data. Data can be collected for 21 days
before the memory is filled and a download of data is necessary to preserve all of
the stored data. If data is not downloaded when memory is full, the newest data
will overwrite the oldest data and only data from the past 21 days will be stored.
At any time during operation, the complete record of temperature trend data can
be displayed as a graph on the screen. This chapter explains how to display
temperature trend data and provides details about the format and structure of the
downloaded data.
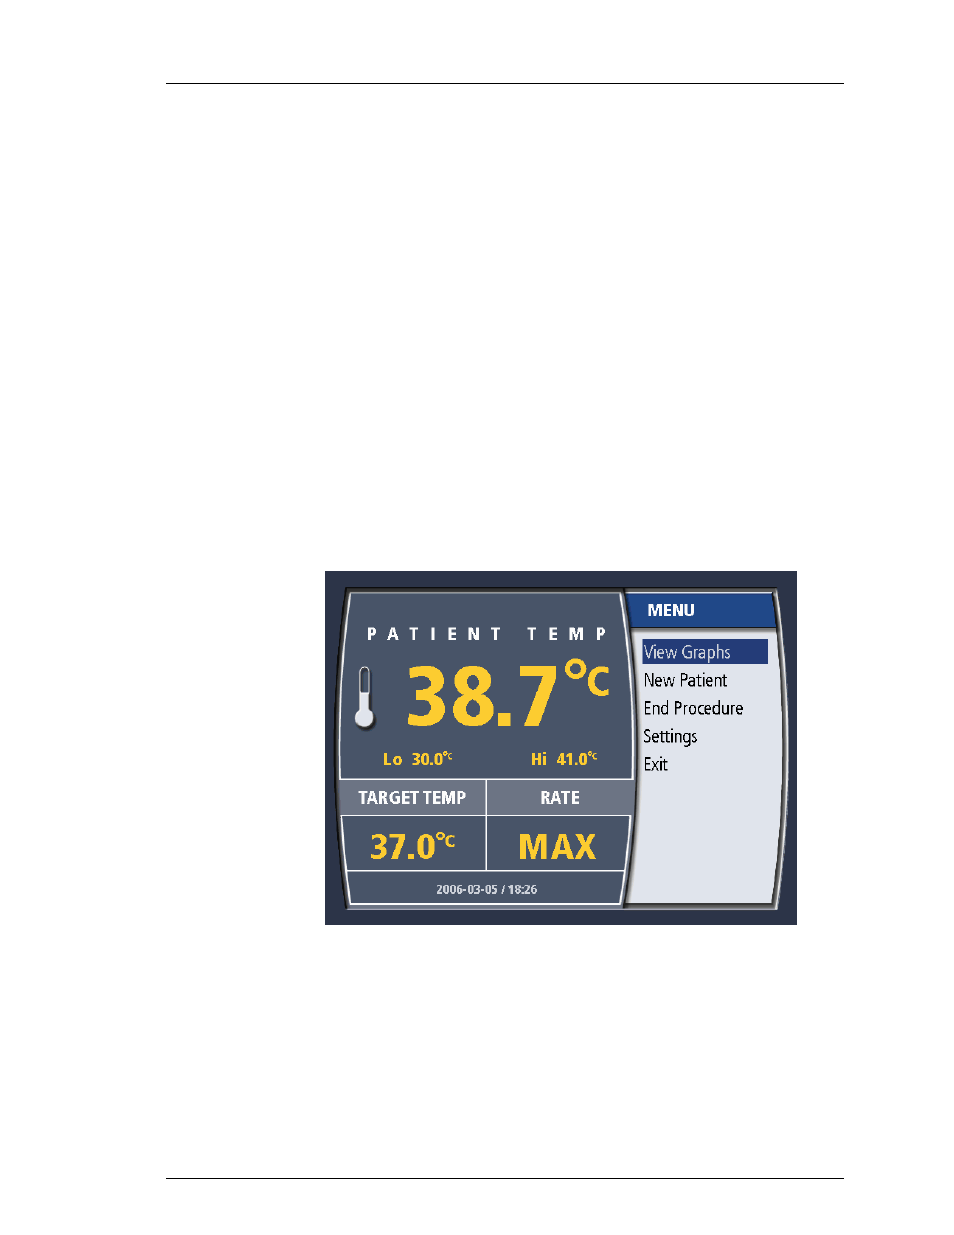
Displaying the Temperature Trend Graph
To display the temperature trend graph, follow these steps:
1. Press
the
Press for Enter/Menu knob once. The screen displays the
menu. The selection “View Graphs” will be highlighted.
Figure 4-67. Menu.
2. Press the knob once. The screen will display the temperature trend graph.
600479-001 Rev 2 88/147