Monitoring devices, Viewing rea, Viewing min/max log – E-Mon E-PS-A-RTU-N User Manual
Page 108: Viewing real
Chapter 4 Power
S O F T W A R E
M O N I T O R I N G D E V I C E S
108
PowerSmart+ Advanced Power Quality Meter
Monitoring Devices
Viewing Rea
Viewing Rea
Viewing Rea
Viewing Reallll----time Data
time Data
time Data
time Data
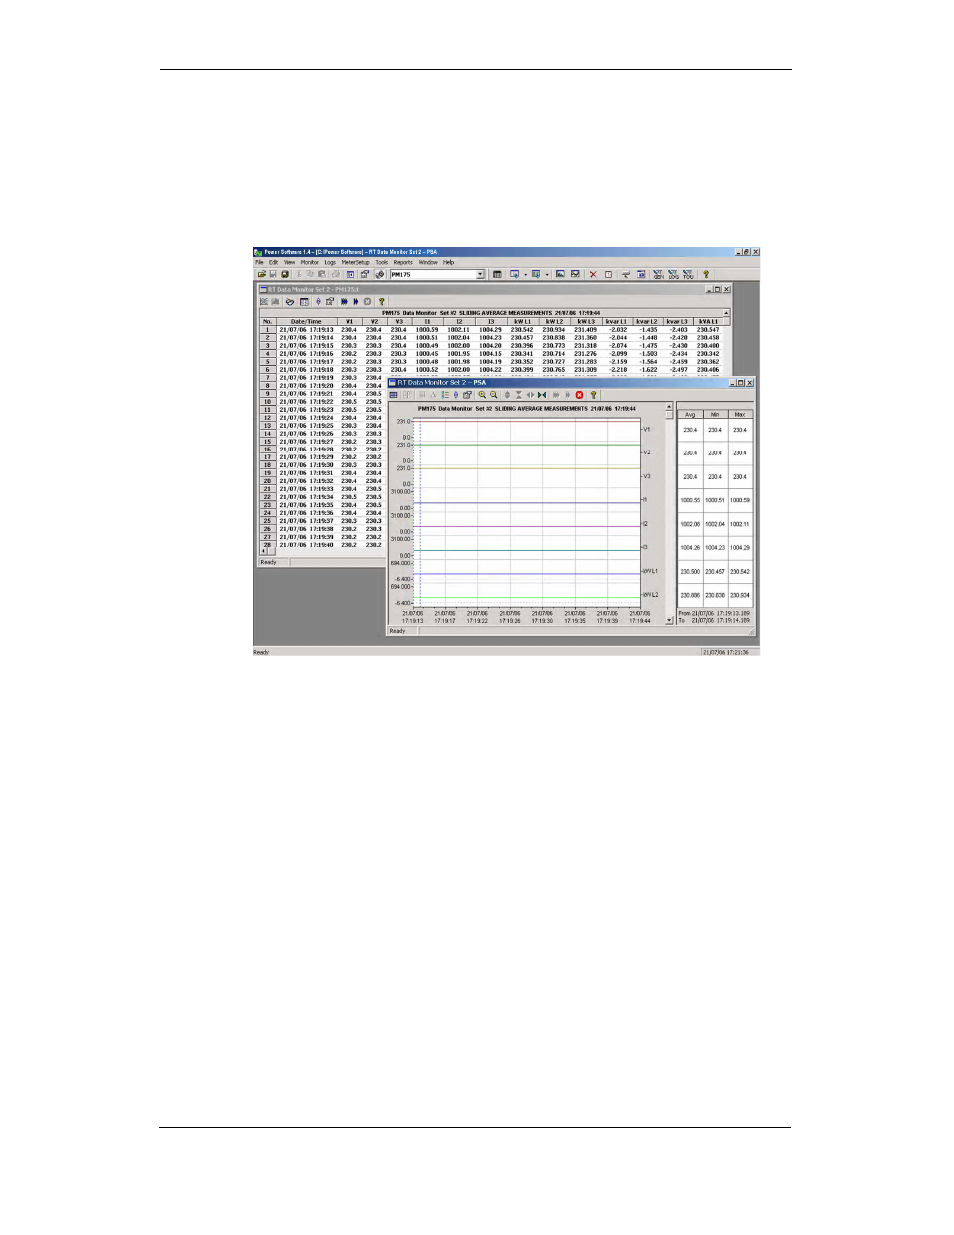
Real-time data is continuously retrieved from your devices, updated on the screen at the
rate you defined in the Instrument Setup, and can be recorded to a file. You can view
acquired data in a tabular or in a graphical form as a data trend.
For information on the real-time data monitoring and recording options, see the “Power
Software Getting Started Guide”.
Any data, energy and maximum demand registers in your meters can be read and
recorded to files through the Power Software Data Monitor. See Appendix D for a
list of data available in your meter.
Viewing Min/Max Log
Viewing Min/Max Log
Viewing Min/Max Log
Viewing Min/Max Log
To retrieve the real-time Min/Max log data from your device, select the device site from the
list box on the toolbar, select RT Min/Max Log from the Monitor menu, and then select a
data set you want to view.
For more information on the Min/Max data monitoring options, see the “Power
Software Getting Started Guide”.
Viewing Real
Viewing Real
Viewing Real
Viewing Real----time Waveforms
time Waveforms
time Waveforms
time Waveforms
The PowerSmart+ Advanced PQM allows you to retrieve and view the real-time waveforms
from your meter.
The waveforms can be displayed in different views as overlapped or non-
overlapped waveforms, as RMS cycle-by-cycle plot, or as a harmonic spectrum
chart or table. For information on using different waveform views, see the “Power
Software Getting Started Guide”.