PASCO PS-2006 GLX Power Amplifier User Manual
Page 24
®
P S - 2 0 0 6 G L X P o w e r A m p l i f i e r
S a m p l e E x p e r i m e n t s : E l e c t r i c a l E q u i v a l e n t o f H e a t
22
2.
Assemble the calorimeter using the plastic spacer to suspend the
inner cup (containing water) in the outer cup.
3.
Place the lid on the calorimeter. Ensure that the probe is underwater
but does not touch the cup.
4.
Make sure that the output of the Power Amplifier is turned off.
5.
Connect the calorimeter’s heating resistor leads to the Power
Amplifier.
6.
Connect the temperature probe to one of the temperature ports on
the side of the GLX.
7.
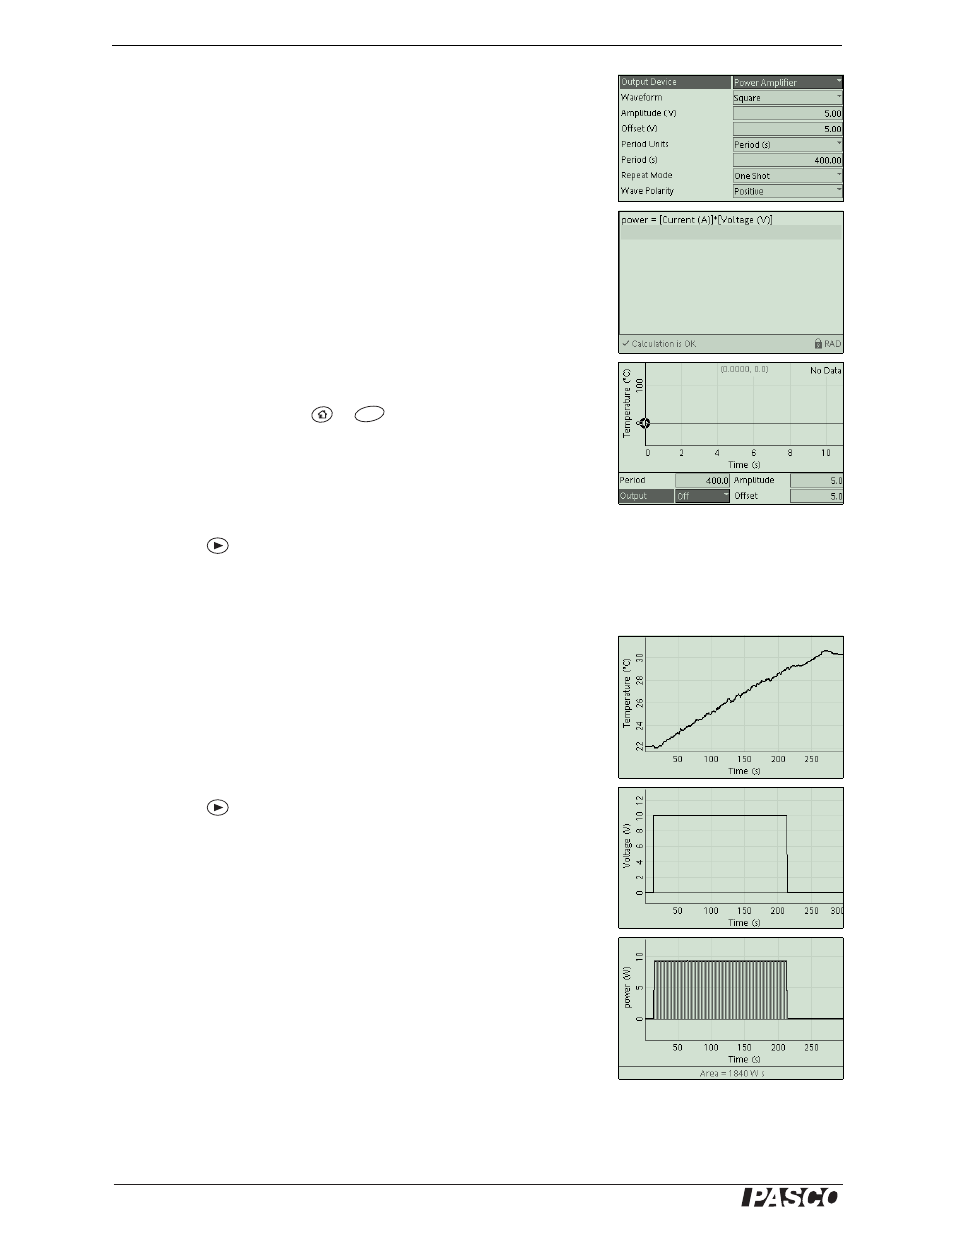
Configure the Output, Calculator, and Graph screens as illustrated
(Figure 21). The output settings will produce a single 10 V pulse
with a duration of 200 s.
8.
In the Sensors screen (
+
), set the sampling rates of all
sensors to 1 Hz.
Procedure
Before you start, make sure that the output is turned off.
1.
Press
to start recording data.
2.
Look at the graph to confirm that the starting temperature is about
3° C below room temperature and relatively constant.
3.
After about 10 s, turn the output on.
4.
Gently swirl the calorimeter every 15 seconds as power is supplied
to the heater.
5.
When the heater turns off (after 200 s), start swirling the calorime-
ter continuously. Continue to swirl until the temperature begins to
decrease.
6.
Press
to stop data recording.
Analysis
1.
Determine the temperature change,
∆T, from the graph.
2.
Use Equation 6 to calculate the total amount of heat added to the
water and to the inner aluminum cup. Remember that the water and
cup each have their own values of mass and specific heat.
3.
In the Graph screen, make a graph of Power versus time. The area
under the power curve is the electrical energy delivered to the calo-
rimeter.
4.
Compare the electrical energy to the total added heat.
Figure 21: GLX Set-up
F4
Figure 22: Data