Rlc circuit – PASCO PS-2006 GLX Power Amplifier User Manual
Page 16
®
P S - 2 0 0 6 G L X P o w e r A m p l i f i e r
S a m p l e E x p e r i m e n ts : R L C C i r c u i t
14
RLC Circuit
In this experiment, the Power Amplifier drives an RLC circuit with a
variable-frequency sine wave.
Part I: Current versus Frequency
Set-up
1.
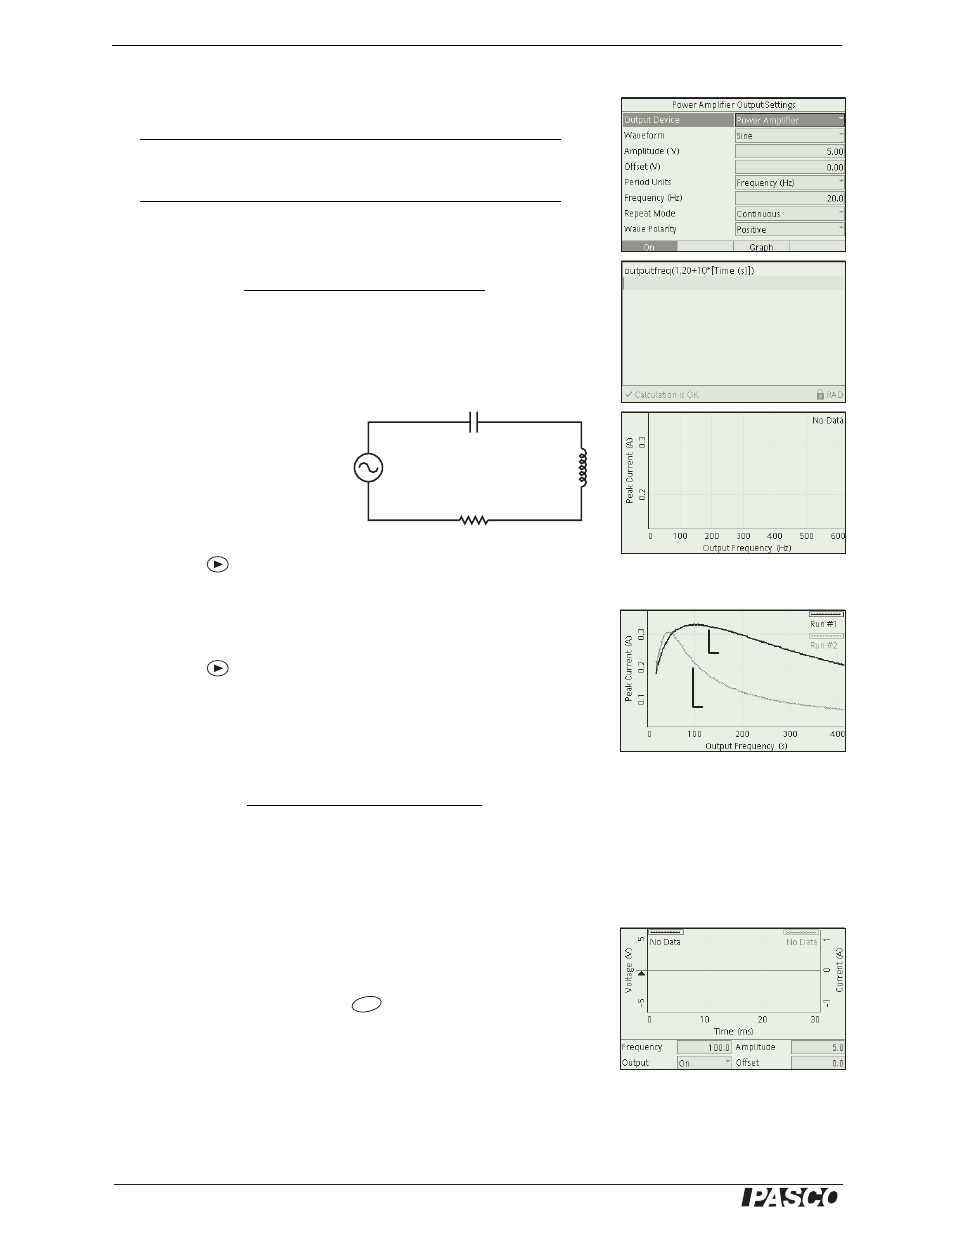
Configure the Output, Calculator, and Graph screens as illustrated
(Figure 3).
2.
Use two patch cords and the
RLC circuit board to create
the illustrated circuit.
Procedure
1.
Turn the output on.
2.
Press
to start data recording.
3.
Watch the Graph screen as the Peak Current versus Frequency is
plotted.
4.
Press
to stop data recording.
Analysis
Identify the resonant frequency where the maximum current amplitude
occurred.
Part II: Phase versus Frequency
Set-up
1.
Delete the calculation in the Calculator screen. (This will allow you
to set the frequency manually.)
2.
Configure the Graph screen as follows:
a.
Open the Graph screen.
b.
From the Graphs menu (
), select New Graph Page. The
GLX creates a voltage versus time graph.
c.
From the Graph menu, select Two Measurements. The GLX
adds a second measurement to the graph.
d.
Change the second measurement (on the right side of the
graph) to Current.
Figure 3: Part I Set-up
Additional Equipment
Part Number
RLC Circuit Board
CI-6512
Patch Cords (2)
SE-9750 or SE-9751
C = 330
µF
R = 10
Ω
L = 8.2 mH
Power
Amplifier
Air core
Metal core
Figure 4: Typical Data
Figure 5: Part II Set-up
F4