PASCO PS-2006 GLX Power Amplifier User Manual
Page 19
®
P S - 2 0 0 6 G L X P o w e r A m p l i f i e r
S a m p l e E x p e r i m e n t s : O h m ’ s L a w a n d R e s i s t i v i t y
17
3.
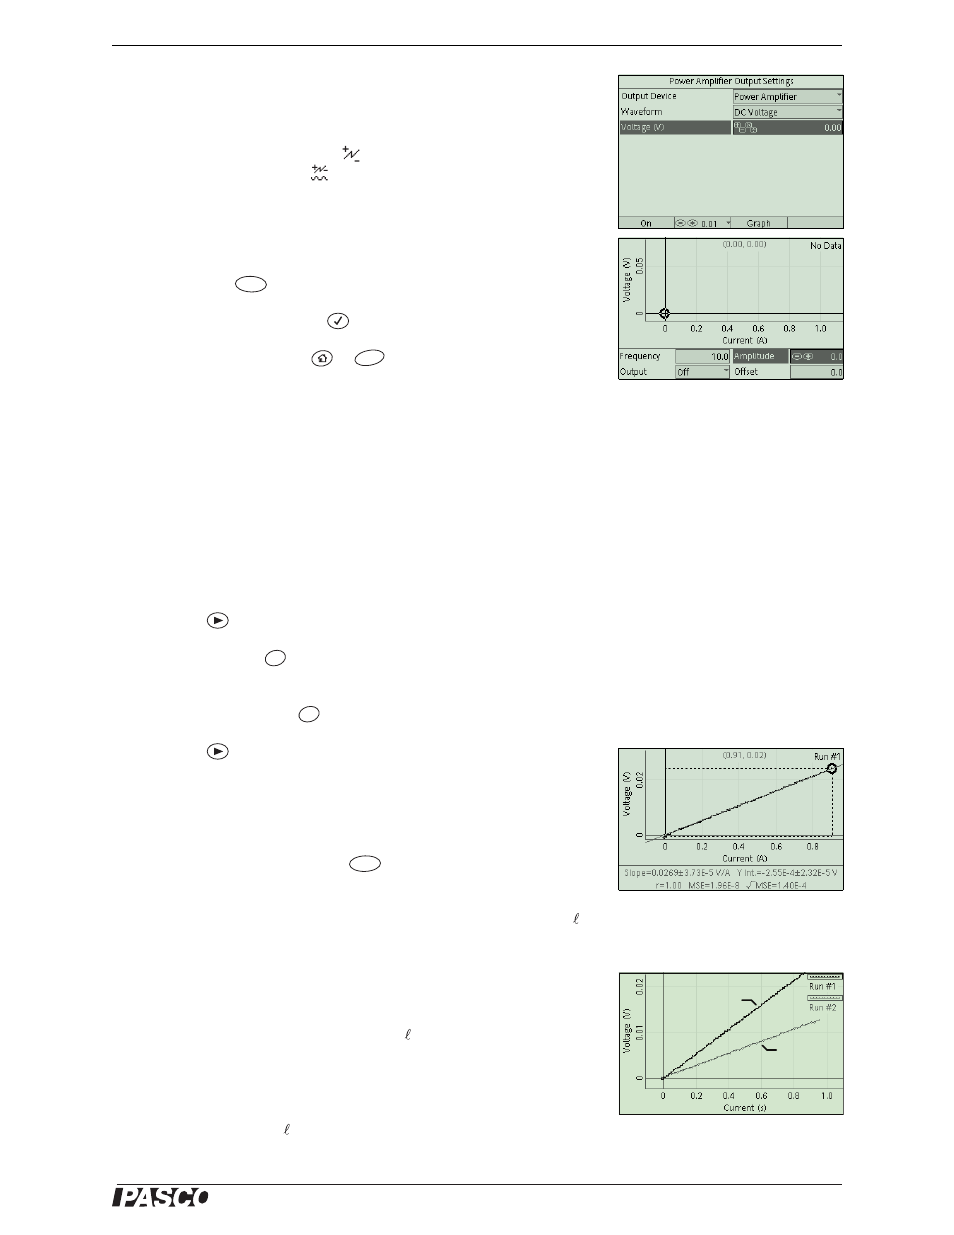
Configure the Output and Graph screens as illustrated (Figure 10).
Be certain that the voltage measurement selected for the vertical
axis of the graph is the measurement made by the galvanometer
sensor, recognizable by the
icon, (not the Power Amplifier’s
measurement with the
icon).
4.
In the Output screen, set the voltage step size to 0.01 V:
c.
Use the arrow keys to highlight Voltage.
d.
Press ,
and
select
Custom Step.
e.
Type 0.01 and press
.
5.
In the Sensors screen (
+
), set the sampling rates of all
sensors to 10 Hz.
Procedure
1.
Open the Graph screen.
2.
Make sure that the output voltage (the Amplitude setting in the
Output Config Panel) is set to 0 V.
3.
Turn the output on.
4.
Use the arrow keys to highlight the Amplitude setting.
5.
Press
to start recording data.
6.
Press and hold
. The output voltage starts increasing.
7.
Watch the increasing current measurement on the graph. Before it
reaches 1 A, release
.
8.
Press
to stop recording data.
9.
Turn off the output.
Analysis
Use the Linear Fit tool (from the
Tools menu) to find the best-fit
line. The slope of the line equals the resistance, R.
Measure the cross-sectional area, A, of the wire. Measure the length, ,
across which the resistance was measured.
The resistivity,
ρ, of the wire material is given by
(eq. 1)
Further Study
•
Measure the resistance of different lengths of the same wire. Make
a plot of R versus . The slope is equal to
ρ/A.
Figure 10: GLX Set-up
F2
F4
+
+
Figure 11: Data
F3
20 cm
10 cm
Figure 12: Two different lengths of the
same wire
ρ
RA
-------
=