Sample experiments, I-v curves – PASCO PS-2006 GLX Power Amplifier User Manual
Page 15
®
P S - 2 0 0 6 G L X P o w e r A m p l i f i e r
S a m p l e E x p e r i m e n t s : I - V C u r v e s
13
Sample Experiments
This section presents some examples of how the Power Amplifier can be used in student labs and classroom
demonstrations.
I-V Curves
In this experiment, the Power Amplifier outputs a slow voltage ramp,
and the GLX plots current versus voltage for a resistor and a light bulb.
Set-up
1.
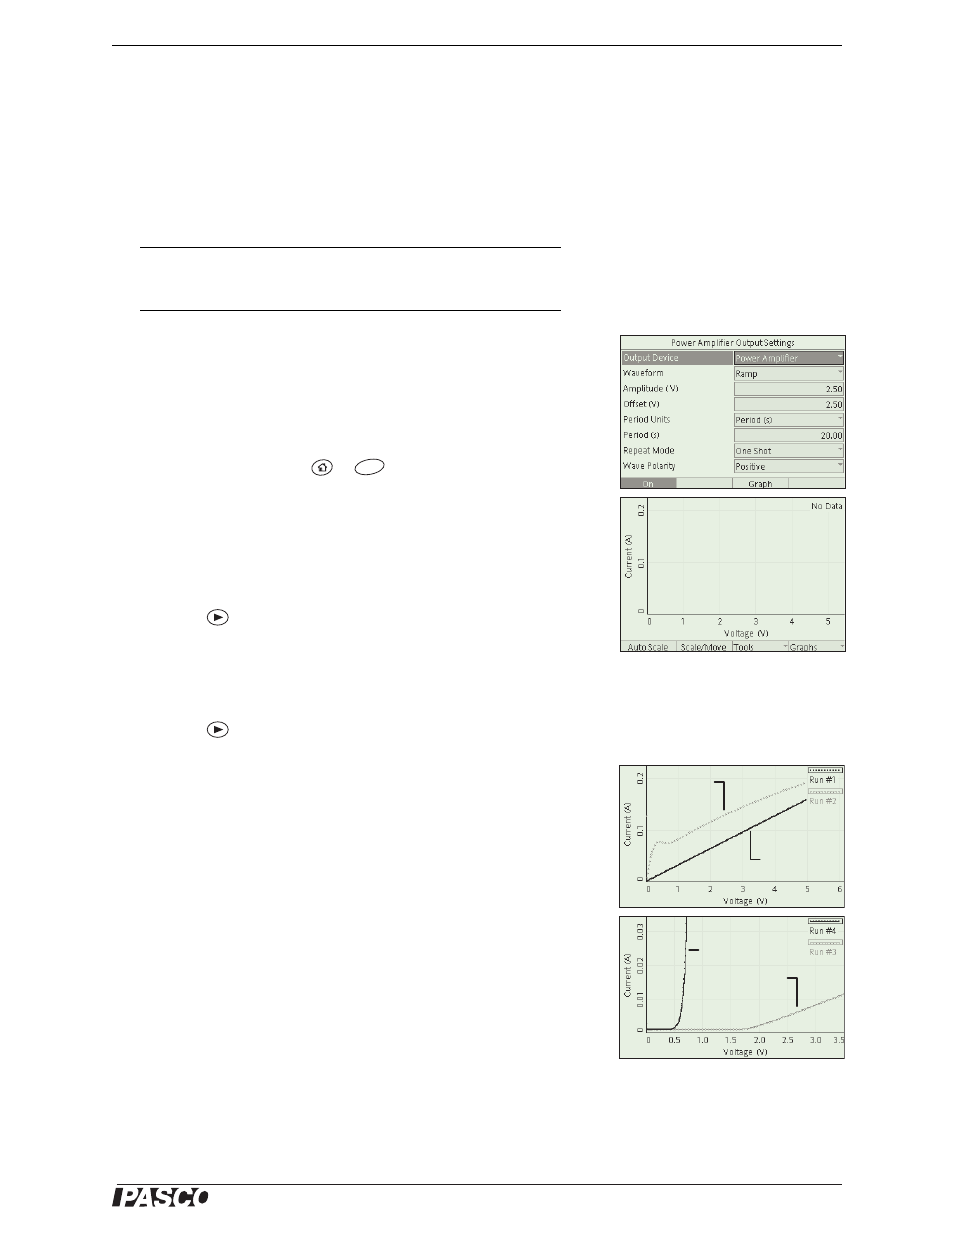
Configure the Output and Graph screens as illustrated (Figure 1).
2.
In the Sensors screen (
+
), set the sampling rates of the
Voltage and Current measurements to 10 samples/s.
3.
Use two patch cords to connect one of the resistors on the circuit
board to the GLX Power Amplifier.
Procedure
1.
Press
to start data recording.
2.
Turn the output on.
3.
Wait until the output turns itself off (after 20 s).
4.
Press
to stop data recording.
5.
Connect a light bulb to the Power Amplifier in place of the resistor.
6.
Repeat steps 1 and 4.
Analysis
Compare the current versus voltage curves for the resistor and light
bulb. The curve for the resistor is linear. The inverse of the slope of the
curve is equal to the resistance.
The light bulb curve is not linear because the resistance changes as cur-
rent increases and the filament becomes hotter. Notice the part of the
curve where the current decreases as the voltage increases.
Further Study
•
Generate an I-V curve for a diode or LED. (It may be necessary to
reduce the maximum voltage of the output ramp.)
Additional Equipment
Part Number
RLC Circuit Board
CI-6512
Patch Cords (2)
SE-9750 or SE-9751
Figure 1: Setup
F4
Light bulb
Resistor
Diode
LED
Figure 2: Typical Data