Liquid Controls SP3850 User Manual
Page 50
SP3850 Flow Computer
46
7.5 Linearization Table
7.5.1 Linearization Table General Information
The Linearization Table is used when the flow input device gives a nonlinear
input signal. The unit uses up to 40 different points, as entered by the
operator, to form a curve for linearizing the input signal.
Notes:
1) A minimum of three points must be set up.
2) If "0" is entered for the frequency of any point other than point 1, the Flow
Computer assumes there are no more points above the points that preceded
them. The display will advance to the next setup prompt.
3) If the input frequency is above the highest or below the lowest frequency
programmed, the unit will use the last known point for the K factor in
computing the resulting actual flow.
4) Frequencies, Hz/Cstks or Roshko numbers should be entered in ascending
order.
7.5.2 Linearization Table for Pulse Inputs
The linearization table for pulse inputs programming is quite simple when
values of frequency and flow are known. The Flow Computer asks for 40
different frequencies (Freq) and 40 corresponding K factors (K). It then uses
this data to determine what the actual flow is for any given input frequency.
Usually the necessary data is provided with the flowmeter.
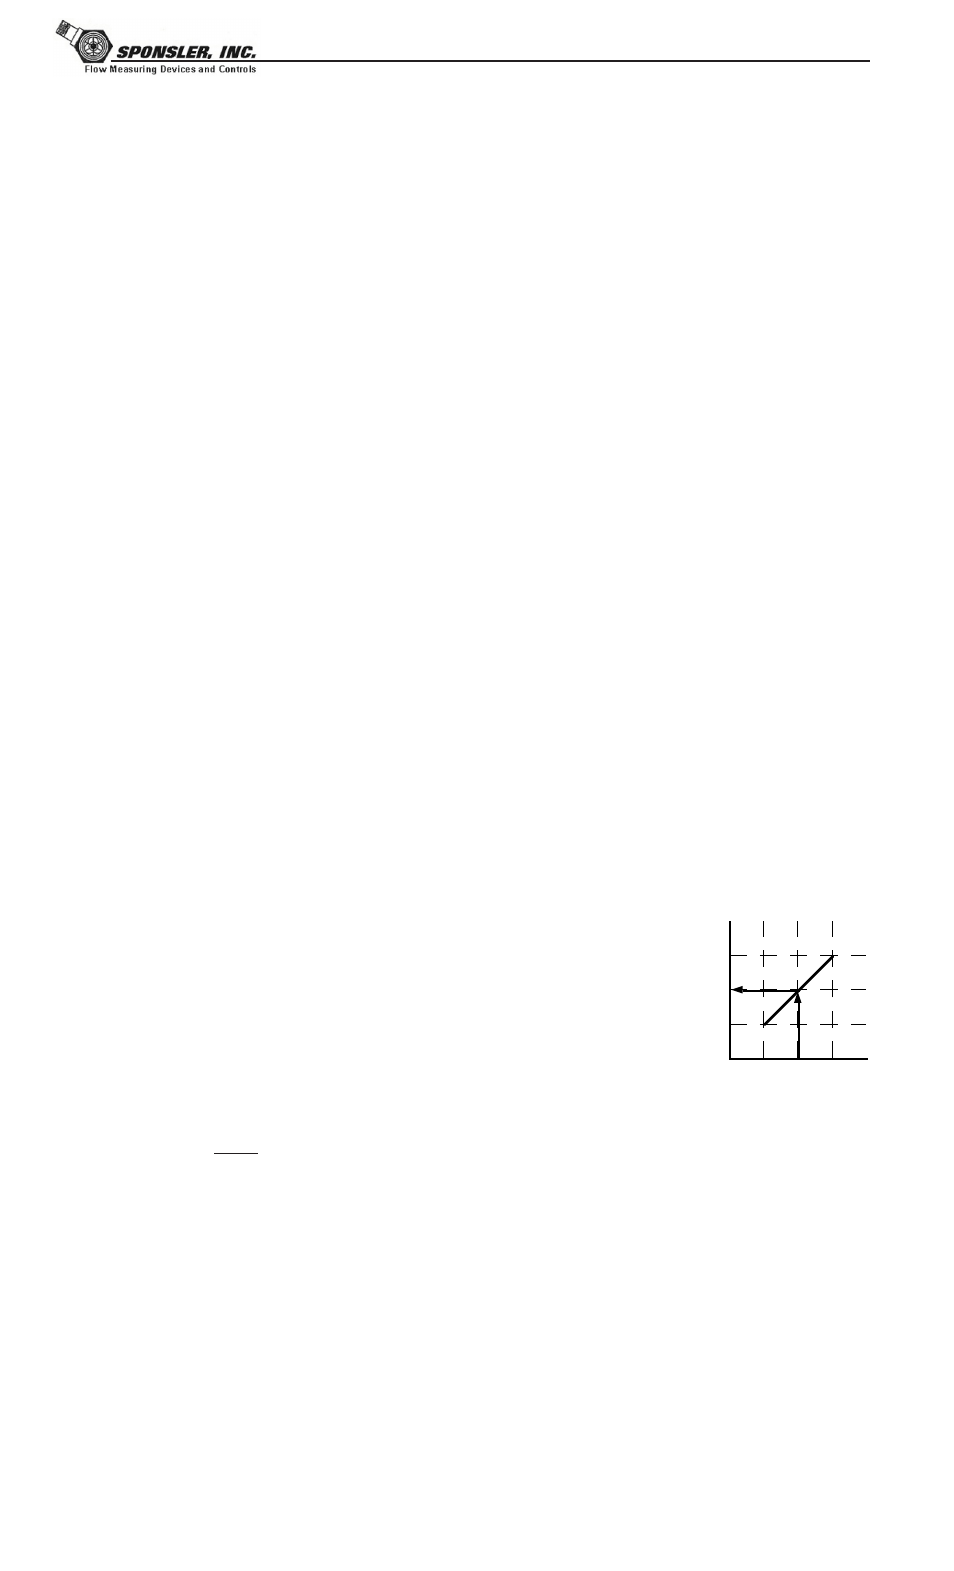
7.5.3 Linearization Table Interpolation
The Linearization Table routine uses the entered data to determine the K
factor for any given input frequency or input flow signal. This is done by taking
the closest data points above and below the input signal, then using those
points to interpolate the K factor, then calculating the uncompensated flow
from the data. Below are the formulas.
Parameters:
Determine closest point above input signal
signal = X, K factor (correction factor) = KA
Determine closest point below input signal
signal = Y, K factor (correction factor) = KB
Let input signal = H,
unknown K factor (correction factor) = KN
To find KN use this formula:
7.6 Universal Viscosity Curve (UVC)
A Universal Viscosity Curve is a presentation of the calibration of a turbine
flowmeter's K-Factor as a function of the Hz/cstks. It is used to represent the
combined effects of flowrate and viscosity on the calibration of the flowmeter. It
is entered as a table of point pairs in ascending order of Hz/cstks.
7.7 Strouhal Roshko Curve (StRo)
A Strouhal Roshko Curve is a presentation of the calibration of a turbine
flowmeter's calibration as a table or curve of Strouhal number as a function of
Roshko number. It is used to represent the combined effects of flowrate,
flowing temperature and viscosity on the calibration of the turbine flowmeter. It
is entered as a table of point pairs in ascending order of Roshko numbers.
KA
KN
KB
Y H X
Input
K factor
x (KA - KB) + KB = KN
H - Y
X - Y
Linearization
Table
General
Information
Linearization
Table
(Pulse Inputs)
Linearization
Table
Interpolation
Universal
Viscosity Curve
Strouhal Roshko
Curve