Horizontal bar graph – MoTeC Display Creator User Manual
Page 34
34
Page Elements
Display Creator User Manual – MoTeC Ⓒ 2014 Published 1 July 2014
www.motec.com
Horizontal Bar Graph
A Horizontal Bar Graph element graphically displays the value of the assigned channel as it varies. This
element is ideal for purposes such as a Gain/Loss bar.
Note the following:
• Each graphical component of the bar graph (as shown in the elements tree), including tick marks and text
values can be formatted and moved anywhere on (or off) the page.
• The bar graph bar is the component of the bar graph to which the input channel is assigned.
• Start and end values, major and minor divisions, and tick text, can all be configured.
• The bar graph can be setup in a non linear progression.
For example: 0, 20, 30, 40, 45, 50, 55, 60, 65 etc.
Linear and non-linear progressions
All progressions are initially linear, as defined in the Configure Ticks window (explained below). A non-linear
progression, as mentioned above, can be defined after the linear bar graph is created. See
.
☛
The Configure Ticks window only defines linear progressions. If it is used after non-linear adjustments are
made, it will revert the progression to linear, and the non-linear adjustments will be lost.
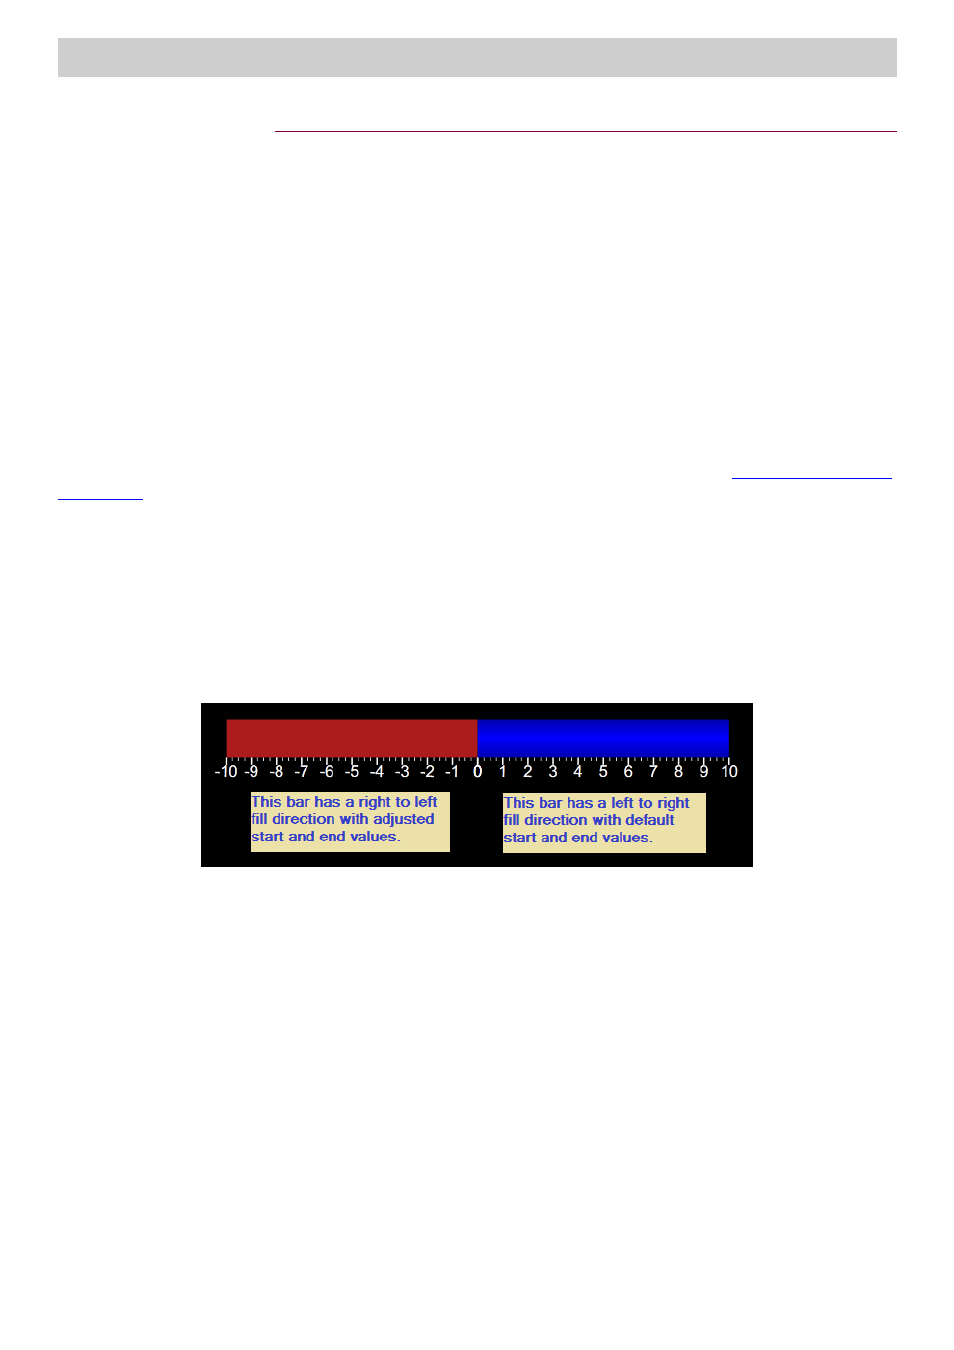
Adjusting direction of fill
The direction in which the bar fills can be selected from the properties pane (left to right or right to left).
However, the start and end values need to be manually changed in the Configure Ticks window (explained
below) to change the progression to fit the purpose. See the following example:
Configuring Ticks
When a bar graph is first created, a Configure Ticks window displays. This can also be displayed later by
selecting the
Configure Ticks
button on the Properties pane.