HP Data Explorer 4 Series User Manual
Page 322
Chapter 7 Data Explorer Examples
7-6
Applied Biosystems
7
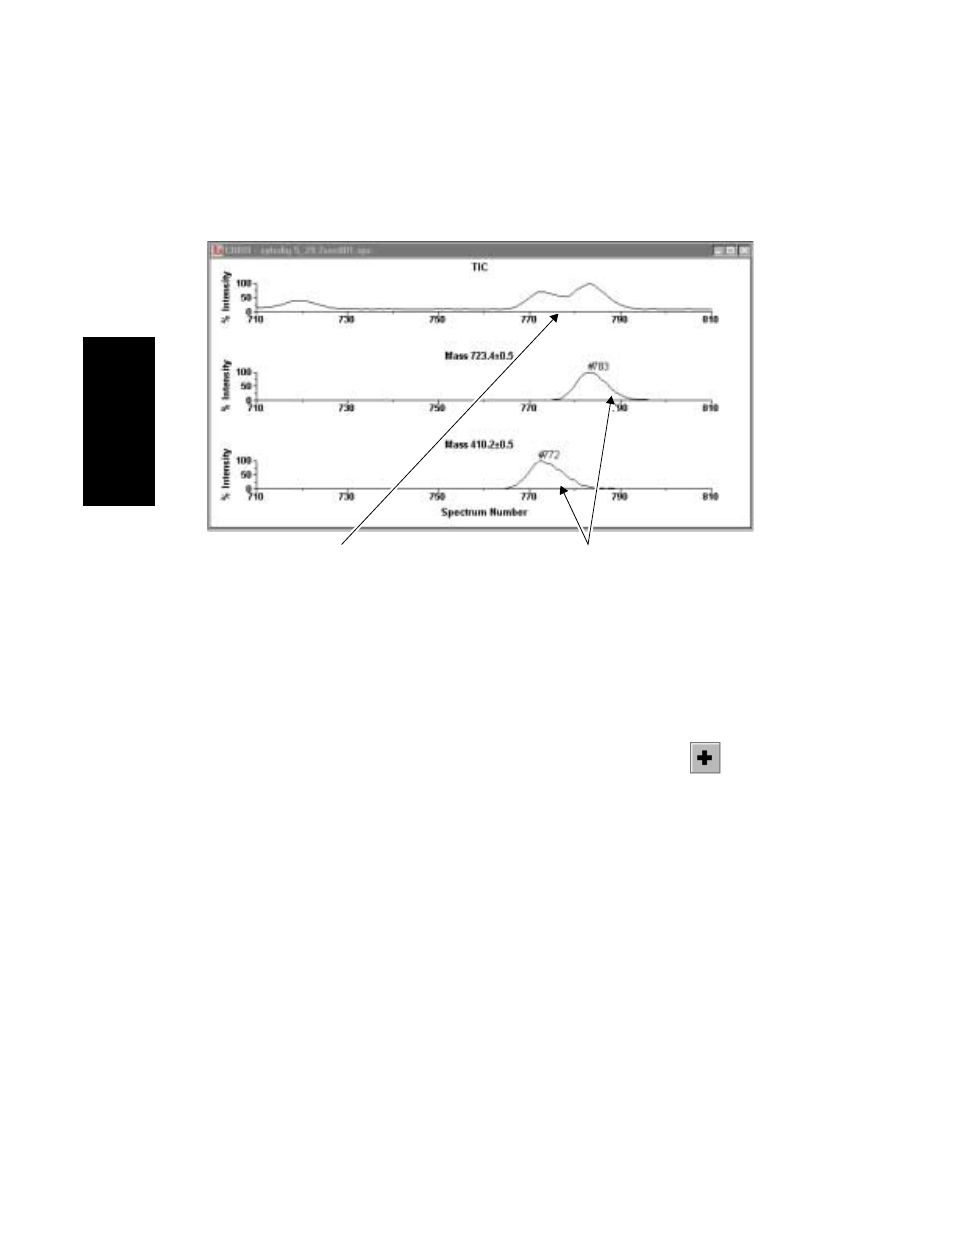
Figure 7-4 Deconvoluting Unresolved Chromatographic Peaks
Creating
combined spectra
Create a combined spectrum for each extracted ion
chromatogram:
1.
Activate the Spectrum window, then click
in the
toolbar two times to add two traces.
2.
Right-click-drag over the first half of the mass range in the
410 extracted ion chromatogram.
3.
Activate the second trace in the Spectrum window.
4.
Right-click-drag over the second half of the mass range in
the 723 extracted ion chromatogram.
Extracted ion
chromatograms with
deconvoluted peaks
Original TIC
containing
unresolved peaks