Traffic trend – average – H3C Technologies H3C Intelligent Management Center User Manual
Page 96
86
5.
Click the Export button to view reports using the IMC Intelligent Analysis Report Viewer and to
print or export all reports found on this page.
a.
To print this report, click the print icon
on the toolbar.
b.
From Page Range, select the page range.
c.
To export the data, click Export.
d.
To export this report, click the export icon
on the toolbar.
e.
From the File Format list, select the export file format. Options are:
•
Crystal Reports (RPT)
•
•
Microsoft Excel (97-2003)
•
Microsoft Excel (97-2003) Data–Only
•
Microsoft Word (97-2003) – Editable
•
Rich Text Format (RTF)
•
Comma Separated Values (CSV)
f.
From Page Range, select the page range.
g.
Click Export.
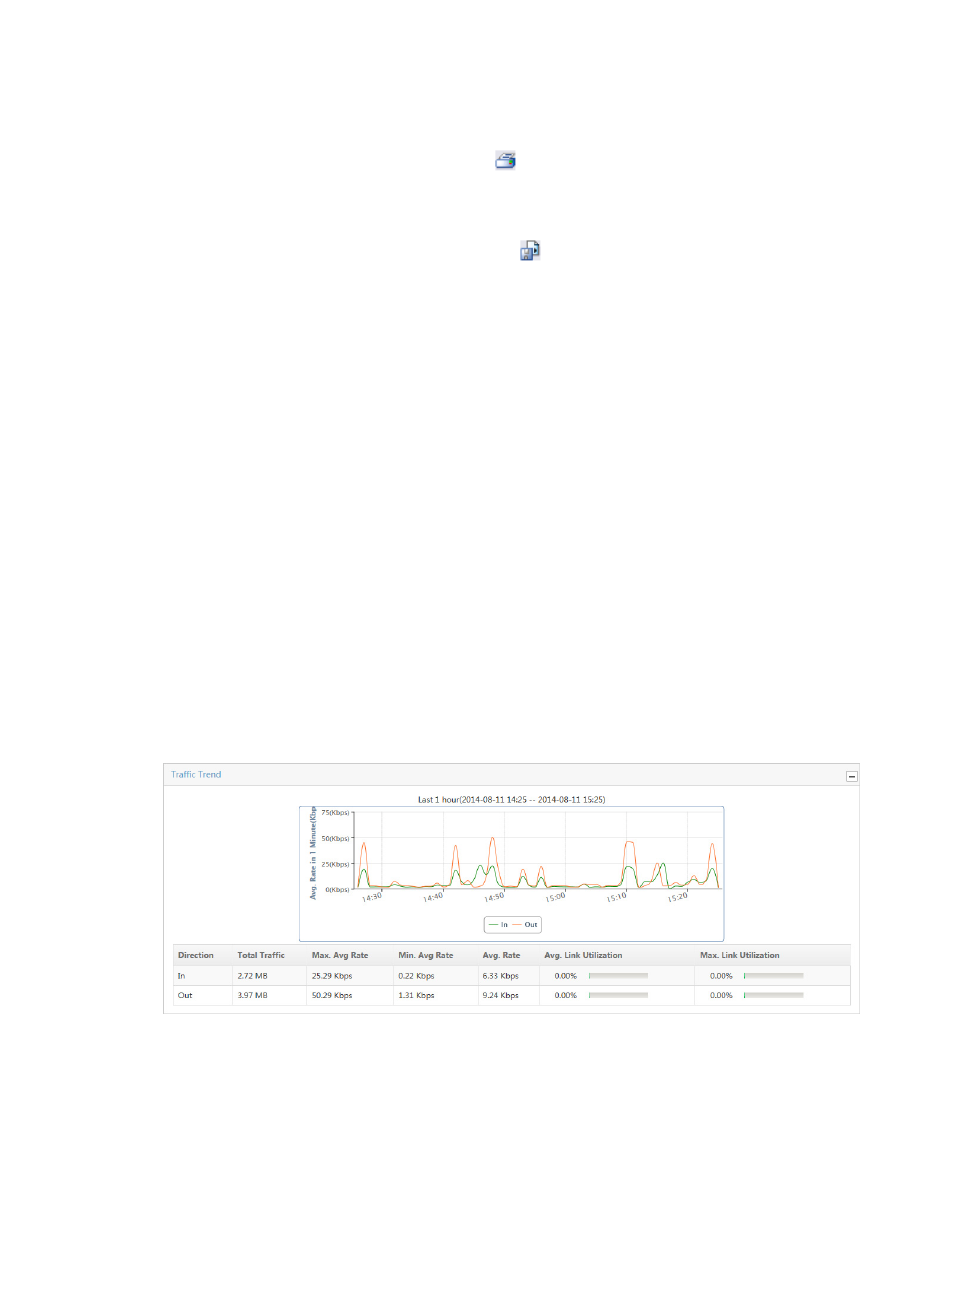
Traffic trend – average
The Traffic Trend combination line chart provides average inbound and outbound traffic rates for all
interfaces in the selected traffic analysis task or for a specific interface in an interface task. This chart also
provides total traffic volume statistics, maximum average, minimum average, average, and link use in a
tabular format for both inbound and outbound traffic for the associated task or interface for the selected
time range. If there is more than one interface for the selected task, these statistics reflects traffic for all
interfaces configured in a task.
Figure 8 Traffic Report: Traffic Trend
If the selected traffic analysis task enabled the Baseline Analysis feature, the Traffic Trend combination
line chart shows two charts: inbound Traffic Trend and outbound Traffic Trend. The green line indicates
the average incoming or outgoing traffic rate, and the orange line indicates the baseline. For more
information about configuring the Baseline Analysis feature for the interface traffic analysis task, see
"