Application category list, Application category traffic trend – H3C Technologies H3C Intelligent Management Center User Manual
Page 114
104
Click the Clear button located to the right of the Application Category field to clear all selected
application categories.
•
Start Time—Enter the start time of the time range, in the format of YYYY-MM-DD hh:mm. Or,
click the Calendar icon
to the right of the input box to manually specify a start time.
•
End Time—Enter the end time of the time range, in the format of YYYY-MM-DD hh:mm. Or,
click the Calendar icon
to the right of the input box to manually specify an end time.
Additionally, to set the start time and end time for the application report, you can click the
query criteria icon in the upper right corner of the application report. On the list that
appears, select Last 1 hour, Last 3 hours, Last 12 hours, Last 24 hours, Last 7 days, Last 30
days, Last 3 months, or Custom. Click the Query icon
in the query criteria area to set the
time range for the traffic report for application categories.
4.
Click OK.
The page displays the results of your query.
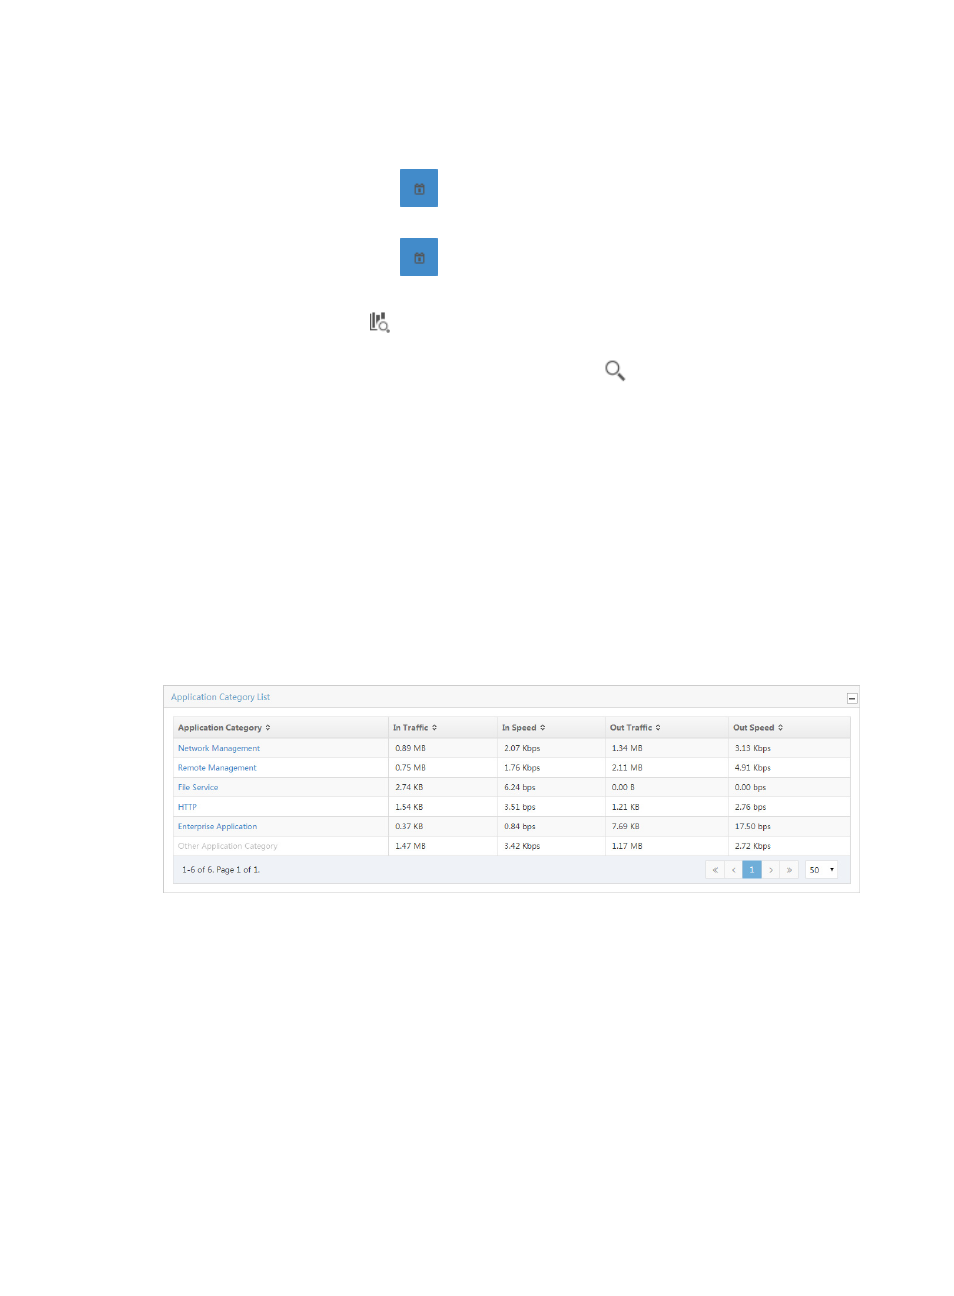
Application category list
The Application Category List provides a list of the application categories observed for all interfaces in
the selected interface traffic analysis task or for an interface in a task for the selected time range. This list
has the application category name, total volume of traffic for the associated application category, rate
of traffic, and the percentage of traffic on all interfaces generated by the associated application category.
The application category name in the Application Category field is a link to reports for the selected
application category.
Figure 30 Application Report: Application Category List
Select 8, 15, 50, 100, or 200 from the lower right side of the main pane to configure how many items per
page you want to view.
Click the name link for an application category to view the report for the individual application category.
For more information about the report for each individual application category, see "
Application category traffic trend
The Application Category Traffic Trend – In/Out stacked area chart provides average
inbound/outbound traffic rates for all application categories observed for all interfaces in the selected
traffic analysis task or for an interface in a task for the selected time range. If there is more than one
interface for the selected task, these statistics reflects traffic for all interfaces configured in a task.