Protocol traffic trend, Individual protocol reports – H3C Technologies H3C Intelligent Management Center User Manual
Page 110
100
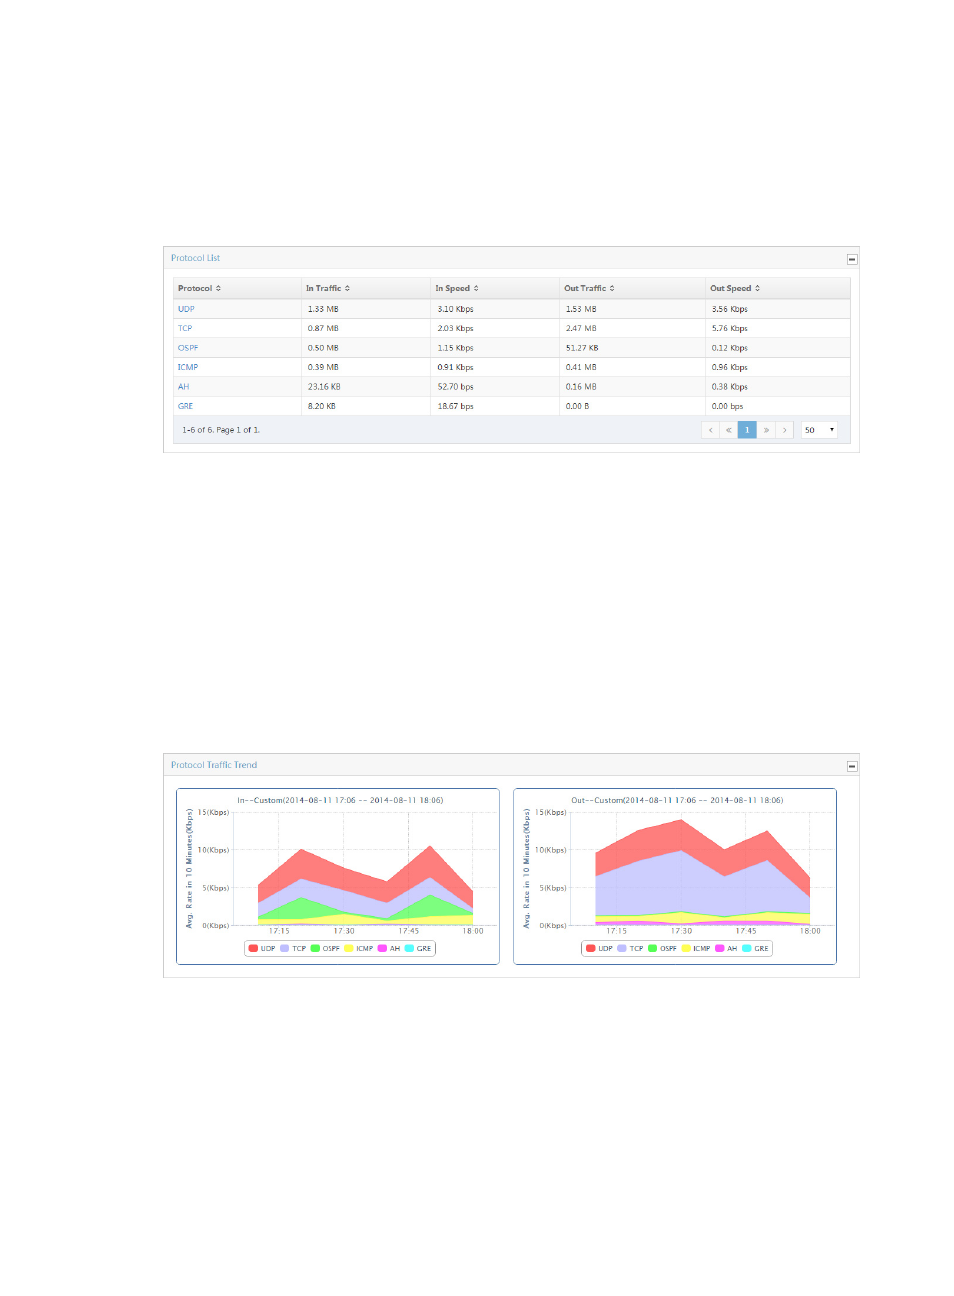
The Protocol List provides a list of the protocols observed for all interfaces in the selected interface traffic
analysis task or for an interface in a task for the selected time range. This list has the protocol name, total
volume of traffic for the associated protocol, rate of traffic and the percentage of traffic on all interfaces
generated by the associated protocol. The protocol name in the Protocol field is a link to reports for the
selected protocol.
Figure 26 Application Report: Protocol List
Select 8, 15, 50, 100, or 200 from the lower right side of the main pane to configure how many items per
page you want to view.
Click the name link for a protocol to see the report for the individual protocol. For more information about
the reports for each individual protocol, see "
Protocol traffic trend
The Protocol Traffic Trend – In/Out stacked area chart provides average inbound/outbound traffic rates
for all protocols observed for all interfaces in the selected traffic analysis task or for an interface in a task
for the selected time range. If there is more than one interface for the selected task, these statistics reflects
traffic for all interfaces configured in a task.
Figure 27 Application Report: Protocol Traffic Trend - In/Out
Individual protocol reports
NTA provides traffic trend statistics for the individual protocol that were observed on the interfaces for a
selected task. Individual protocol reports have the Protocol Traffic Trend report that displays the average
rate of traffic for the selected protocol and a source and destination host list that identifies which source
and destination hosts contribute the greatest volume of traffic for the selected protocol. Individual
protocol reports also have the TopN Protocol Usage List source and destination hosts.