Application reports, Query applications – H3C Technologies H3C Intelligent Management Center User Manual
Page 178
168
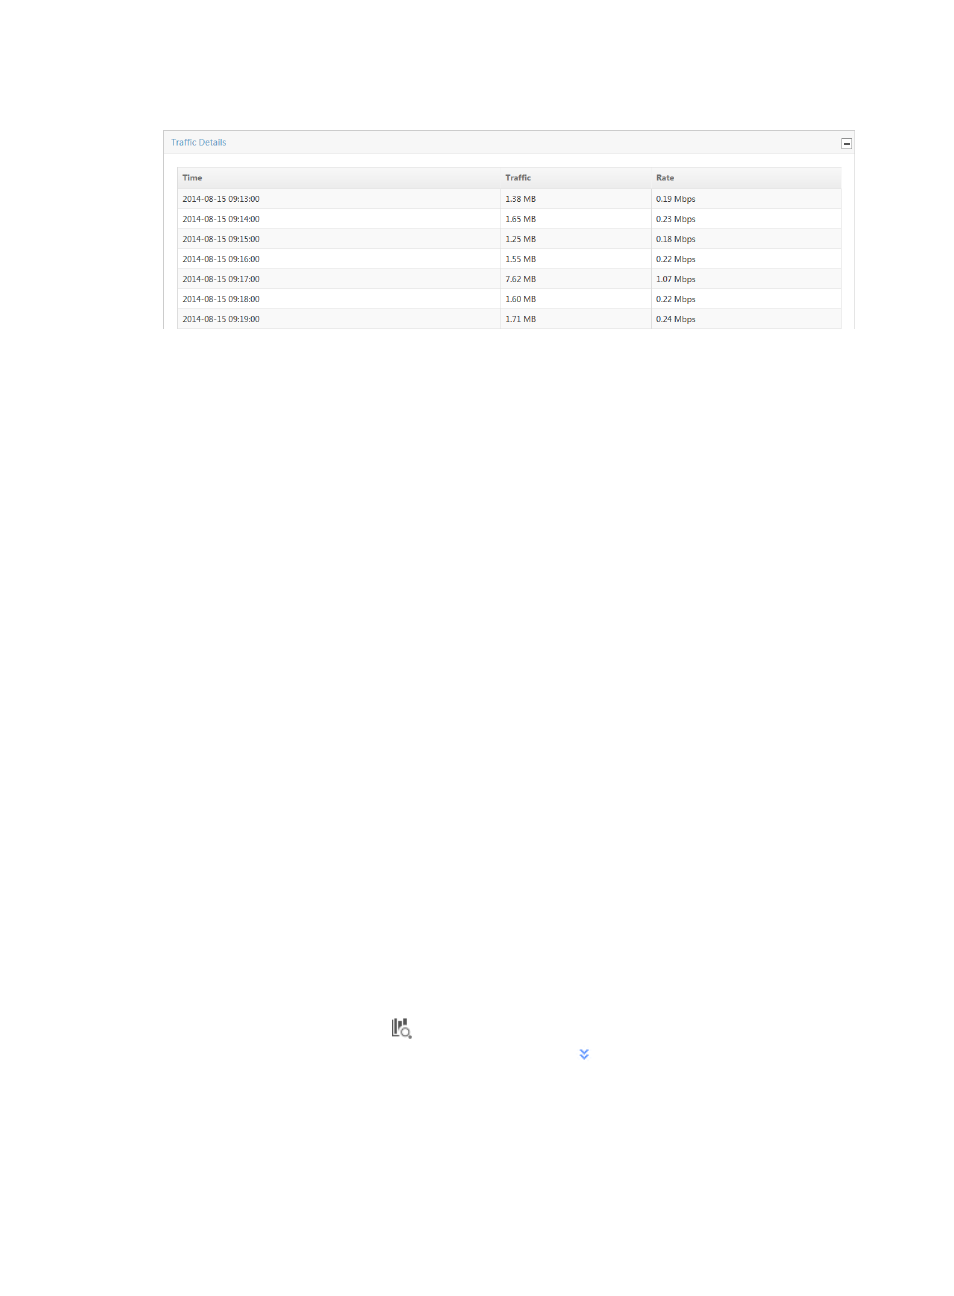
Figure 94 Traffic Report: Traffic Details
Application reports
Application reports provide rate of traffic statistics by application, by protocol, and by application
category for a task, with details for an individual application. Application reports for a probe traffic
analysis task include the Application List, which provides a list of applications captured by the probe in
the selected probe traffic analysis task. This report also provides additional reports for the selected
application. The Application Traffic Trend stacked area chart displays average traffic rates for all
applications captured by the probe in the selected traffic analysis task.
Protocol reports for a probe traffic analysis task include the Protocol List, which provides a list of protocols
captured by the probe in the selected probe traffic analysis task. This report also links to additional
reports for the selected protocol. The Protocol Traffic Trend stacked area chart provides average traffic
rates for all protocols captured by the probe in the selected traffic analysis task.
Application category reports for a probe traffic analysis task include the Application Category List,
which provides a list of the application categories captured by the probe in the selected probe traffic
analysis task. This report also provides additional reports for the selected application category. The
Application Category Traffic Trend stacked area chart provides average traffic rates for all application
categories captured by the probe in the selected traffic analysis task.
NTA provides a query option for filtering reports based on criteria you define. To view the reports for a
probe task, click the Application tab to view application reports for the selected probe traffic analysis task,
and set Query Type to Application as described in "
Application reports display reports organized by the list of applications in NTA. NTA provides many
system defined applications and NTA also supports user defined applications. For more information on
applications in NTA, see "
." The following information describes the reports
available for applications.
Query applications
NTA enables you to change the filter criteria for application reports. You can change the default settings
for query type, application, or time range for the graphs and tables to customize the reports listed on the
Application tab.
1.
Click the query criteria icon
in the upper right corner of Application Report, and select Custom
from the list that appears. Or, click the Advanced icon
to the right of the query criteria field to
expand the query criteria setting area.
2.
Select Application from the Query Type list.
The page displays the report for Layer 4 through Layer 7 applications.
3.
Enter or select the other query criteria: