Individual application reports, Application traffic trend – H3C Technologies H3C Intelligent Management Center User Manual
Page 297
287
range. If there is more than one VPN for the selected task, these statistics reflect traffic for all VPNs
configured in a task.
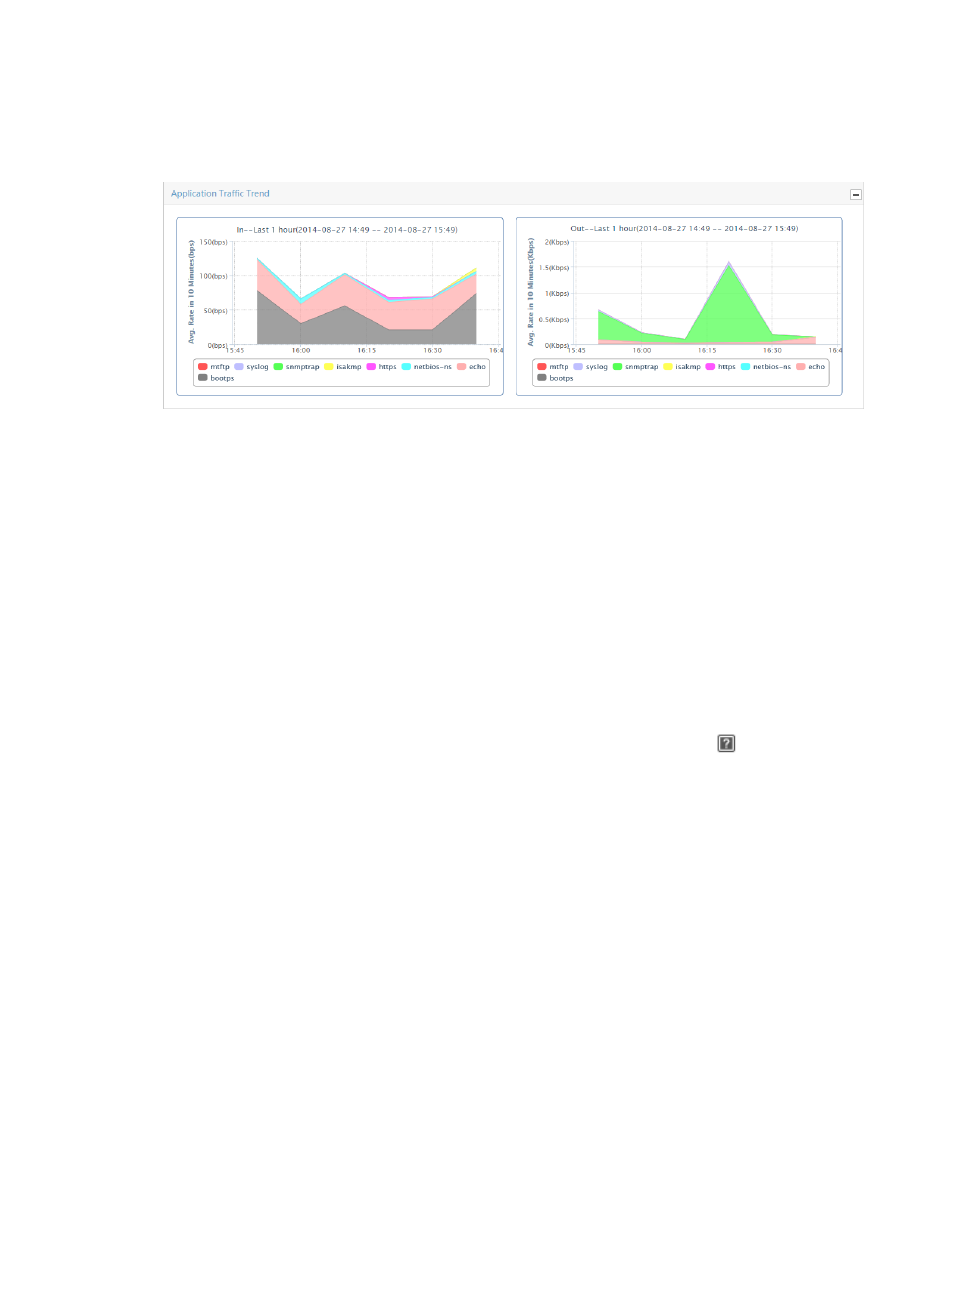
Figure 190 Application Report: Application Traffic Trend – In/Out
Individual application reports
NTA provides traffic trend statistics for the individual applications that were observed on the VPNs for a
selected task. Individual application reports include the Application Traffic Trend report that displays the
average rate of traffic for the selected application. Individual application reports also include the TopN
Application Usage List for source and destination hosts, which identifies which source and destination
contributed the greatest volume of traffic for the selected application. Also included are reports for
unknown TCP and UDP applications.
Unknown applications are those applications for which the Layer 4 TCP or UDP port number has not
been assigned a name and is not included as an application in NTA. For more information on assigning
names to TCP or UDP ports and adding them as applications to NTA, see "
To view individual application reports for a host traffic analysis task, click the name in the Application
field of the Application List report for the application for which you want to view this report.
To view unknown application reports for a host traffic analysis task, click the icon
in the Application
field of the Application List report for the application for which you want to view this report.
Application traffic trend
The Application Traffic Trend — In/Out graph provides average rate of traffic for an individual
application for all VPNs in the selected traffic analysis task. If there is more than one VPN for the selected
task, this chart reflects traffic for all VPNs configured in a task.
By default, the Application Traffic Trend — In/Out report graph displays statistics for the previous hour.
•
To view data for an earlier period, click the Previous button located in the upper right corner of the
chart.
•
To view data for a later period, click the Next button located in the upper right corner of the chart.
•
Click Back to return to the main Application report page.