Query traffic, Topn avg. rate – H3C Technologies H3C Intelligent Management Center User Manual
Page 339
329
summary of flux and rate statistics between business tasks and other traffic. As with each of the report
types, NTA also provides you with a query option for filtering reports based on criteria you define.
Click the Interest tab in the inter-business traffic analysis report to view the interest reports of the task.
Query Traffic
NTA enables you to change the filter criteria for traffic reports. Using the Query Traffic option, you can
refine the data presented in inter-business reports. You can change the default settings for the business
name, as well as the time range for the graphs and tables, to customize the reports displayed under the
Interest tab.
1.
In the query criteria area in the upper right corner of the inter-business report, click the query
criteria icon
. On the list that appears, select Last 1 hour, Last 3 hours, Last 12 hours, Last 24
hours, Last 7 days, Last 30 days, Last 3 months, or Custom. Click the Query icon
in the query
criteria area to set the time range for the traffic report.
2.
To customize the time range for the inter-business report, select Custom from the list that appears
in the query criteria area, or click the Advanced icon
to the right of the query criteria field to
expand the query criteria setting area.
a.
Enter or select the following query criteria:
•
Start Time—Enter the start time of the time range, in the format of YYYY-MM-DD hh:mm.
Or, click the Calendar icon
to the right of the input box to manually specify a start
time.
•
End Time—Enter the end time of the time range, in the format of YYYY-MM-DD hh:mm. Or,
click the Calendar icon
to the right of the input box to manually specify an end
time.
b.
Click OK.
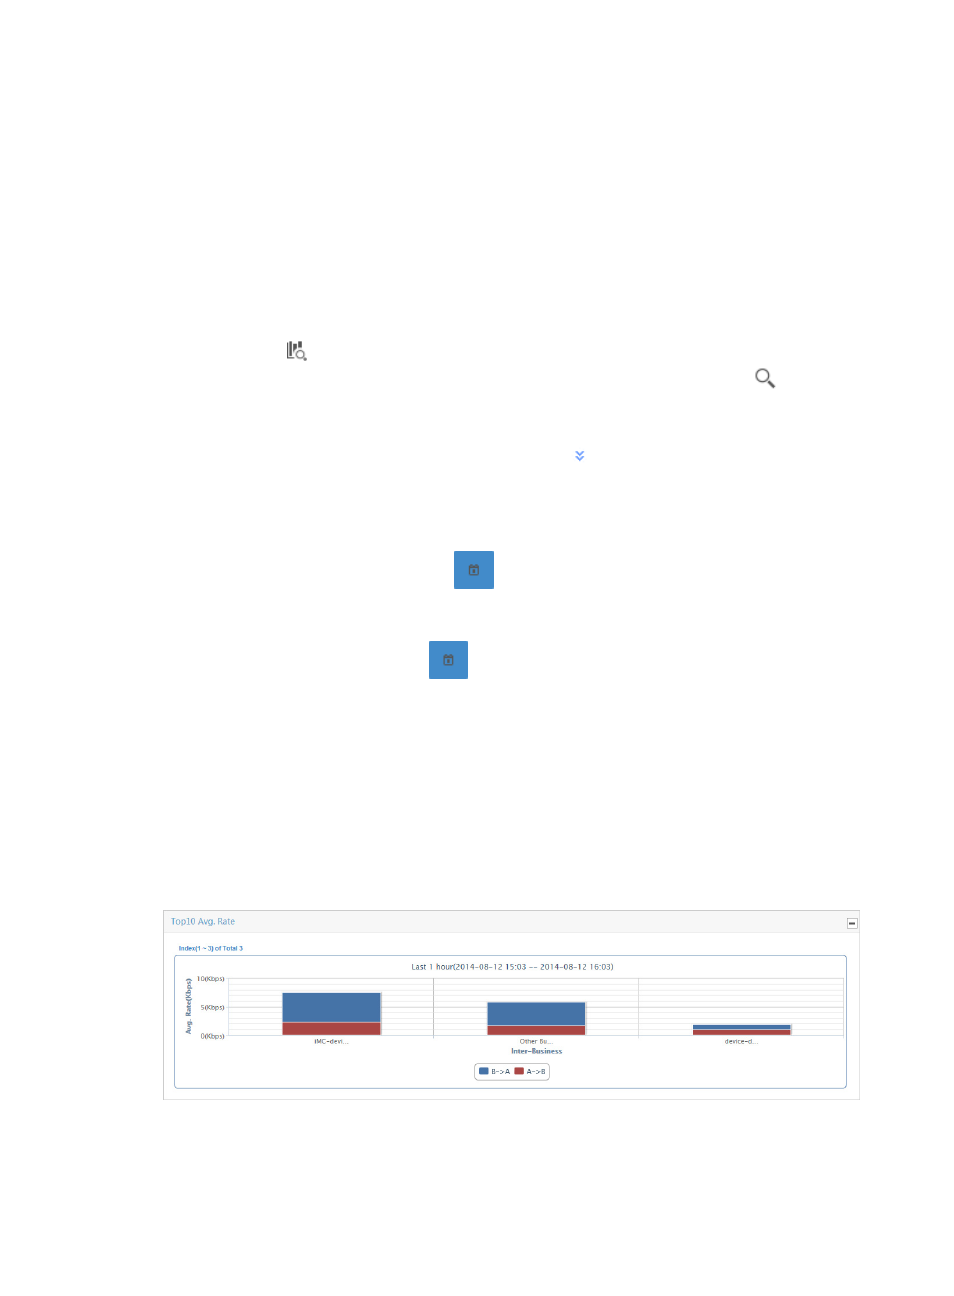
TopN Avg. Rate
The TopN Avg. Rate stacked bar chart provides average per second inbound and outbound traffic rate
observed between all single business and inter-business traffic and other traffic entries in the Traffic
Details list saved by operators to the Interest List. The bars in the graph serve as a link for navigating to
more granular reports.
Figure 228 Interest Report: TopN Avg. Rate Report
By default, the TopN Avg. Rate stacked bar chart displays statistics for the previous hour.