Traffic details, Session reports – H3C Technologies H3C Intelligent Management Center User Manual
Page 200
190
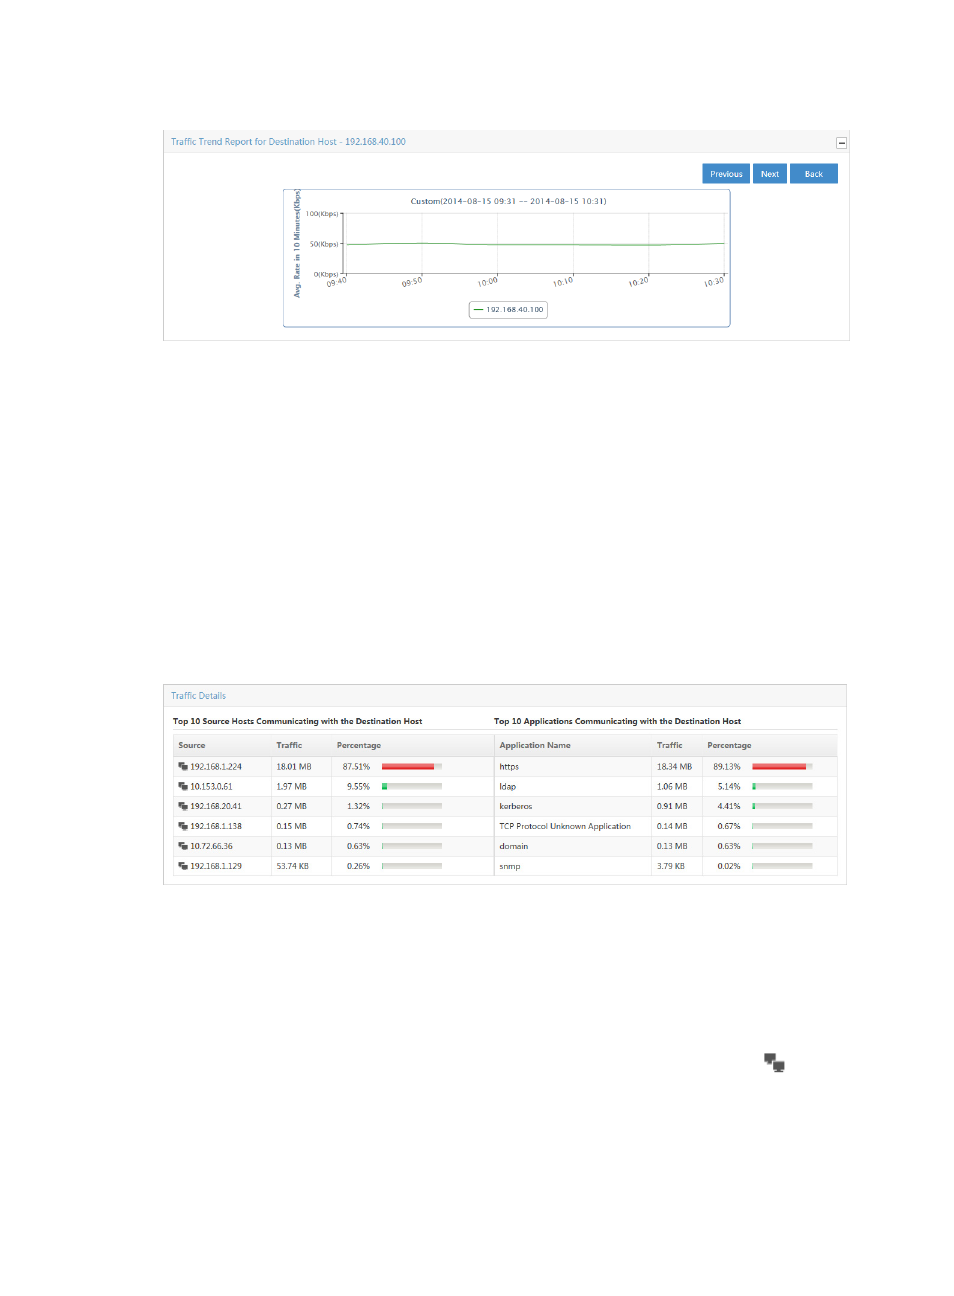
Figure 119 Destination Report: Traffic Trend Report for Destination Host
Traffic details
To view this report for a probe task, click the bar of the bar chart on the TopN Traffic Report for
Destination Host report for the destination host you want to view statistics for. Or, click the IP address for
the destination host you want to view statistics for from the TopN Traffic List for Destination Host list.
The Traffic Details for a destination host table provides two lists. The TopN Source Hosts Communicating
with the Destination Host displays the TopN source host IP addresses, the volume of traffic sent and
received between this destination host and the source hosts, and the percentage of all traffic observed for
this destination host and the source hosts.
The TopN Applications Communicating with the Destination Host displays the TopN applications, the
volume of traffic attributed to the associated application for the selected destination host, and the
percentage of the associated application traffic observed for this destination host.
Figure 120 Destination Report: Traffic details
Session reports
A session is a unique source and destination pair. Session reports include the TopN Traffic Report for
Session Host chart that provides the distribution of traffic for the TopN session pairs for the selected traffic
analysis task for the selected time range. This report also contains a link to traffic reports for the selected
host. Session reports also include the TopN Traffic List for Session Host that provides a list of the TopN
session pairs measured by volume of traffic observed for the selected probe traffic analysis task. This
report also contains a link to reports for the selected session host. The host query icon
next to the
Session IP address is a link for initiating a probe query and a link to the results of the query. As with all
of the report types for a probe task, NTA also provides a query option for filtering reports based on
criteria you define.
To view the reports for a probe task, click the Session tab to view traffic reports for the selected probe
traffic analysis task.