Application list, Application traffic trend – H3C Technologies H3C Intelligent Management Center User Manual
Page 180
170
•
•
Microsoft Excel (97-2003)
•
Microsoft Excel (97-2003) Data–Only
•
Microsoft Word (97-2003) – Editable
•
Rich Text Format (RTF)
•
Comma Separated Values (CSV)
f.
From Page Range, select the page range.
g.
Click Export.
Application list
The Application List provides a list of the applications observed for the selected probe traffic analysis task
during the selected time range. This list displays the application name, a link for viewing the ports for all
unknown applications, total volume of traffic for the associated application, rate of traffic, and the
percentage of traffic on all probes generated by the associated application. The application name in the
Application field is a link to reports for the selected application.
Figure 95 Application Report: Application List
Select 8, 15, 50, 100, or 200 from the lower right side of the main pane to configure how many items per
page you want to view.
To view this report for an individual application, click the name link for the application. For more
information about the individual application reports, see "
Individual application reports
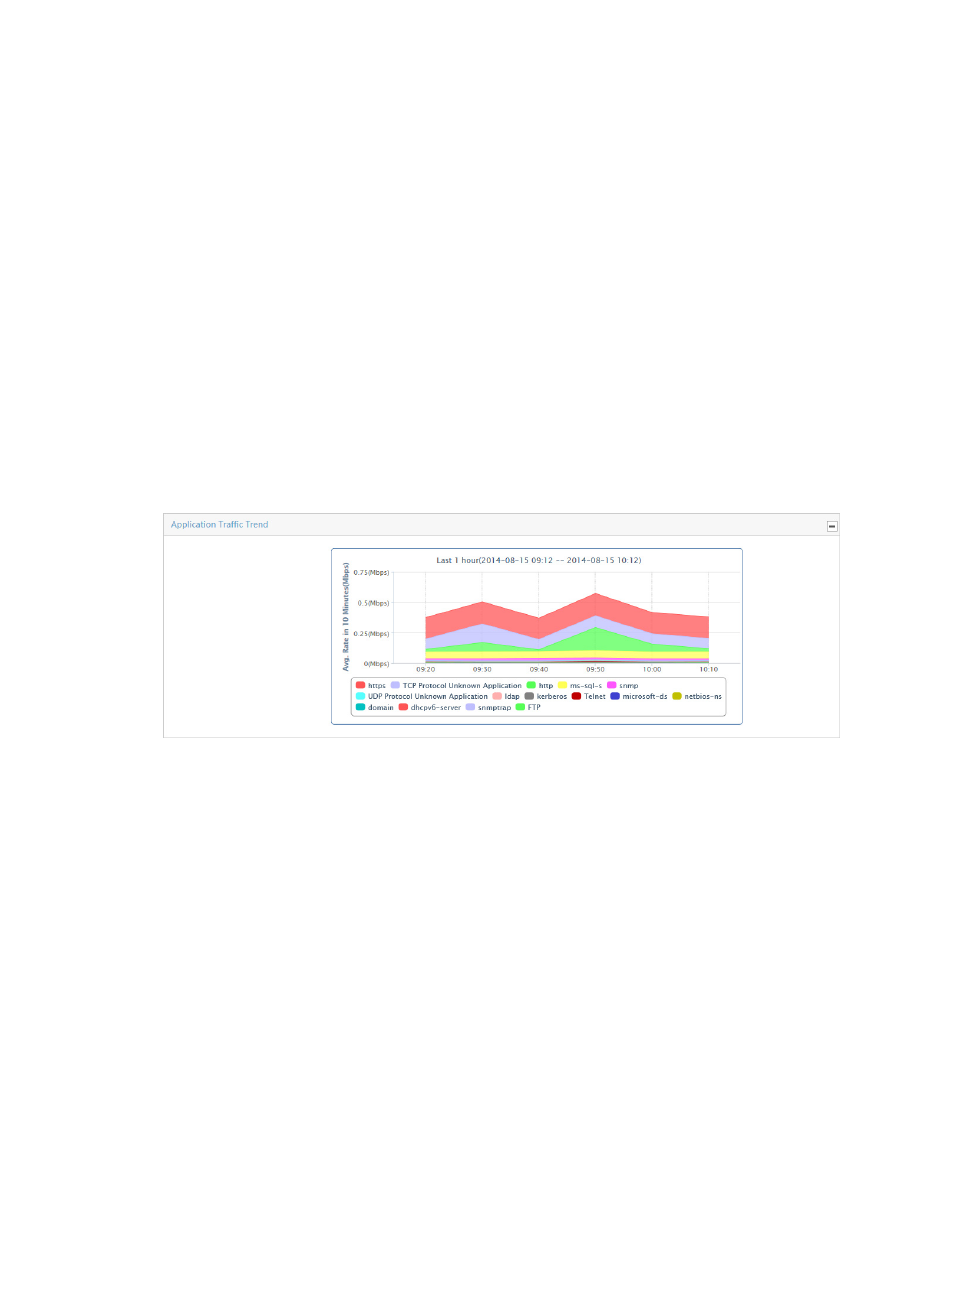
Application traffic trend
The Application Traffic Trend stacked area chart provides average traffic for all applications observed for
the selected traffic analysis task for the selected time range.