H3C Technologies H3C Intelligent Management Center User Manual
Page 156
146
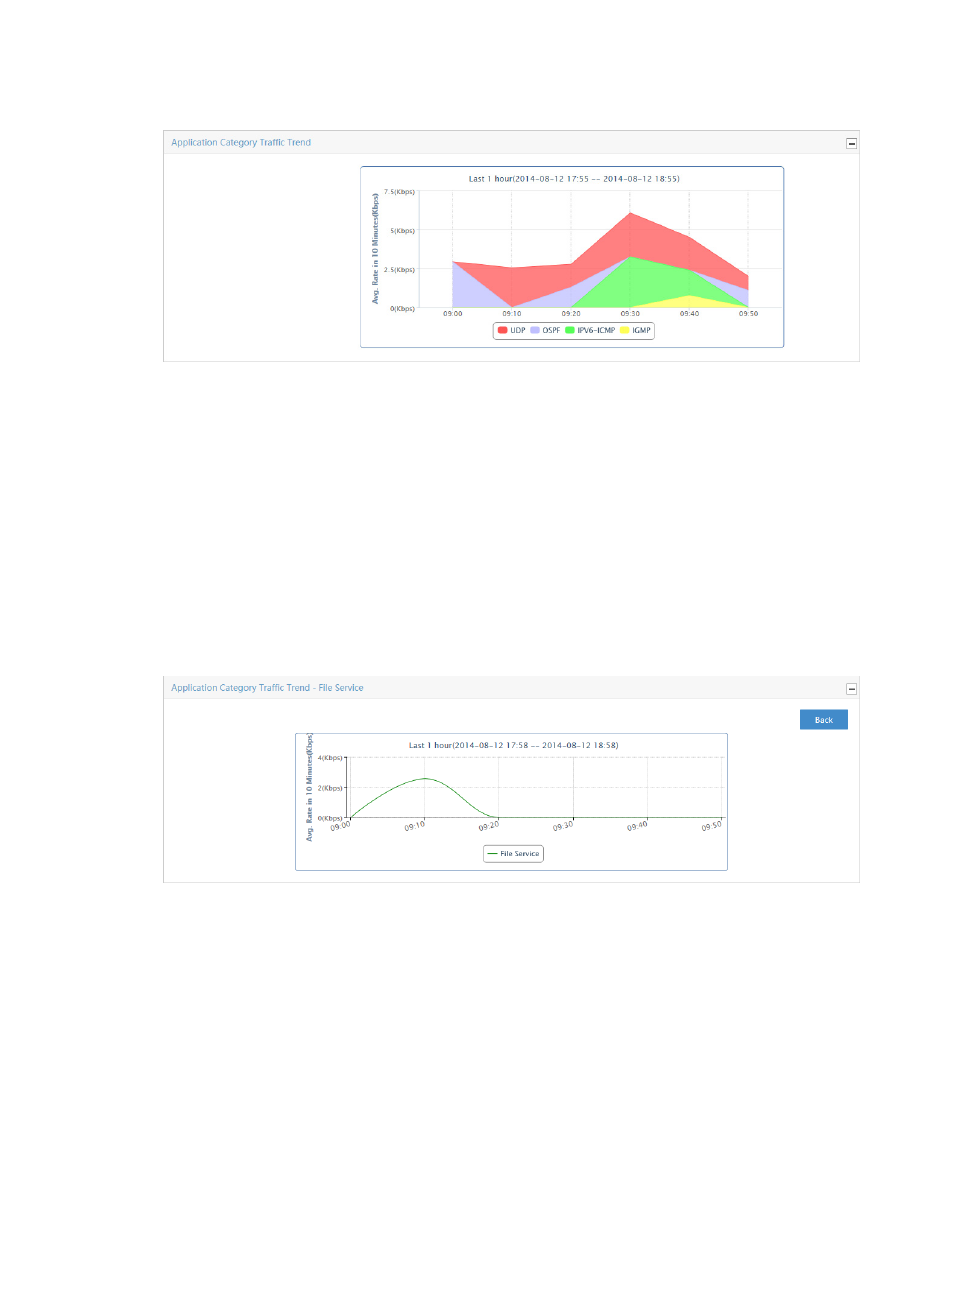
Figure 75 Application Category Report: Application Category Traffic Trend
Application category traffic trend for an individual application category
The Application Category Traffic Trend graph provides the average rate for an individual application
category for all VLANs in the selected traffic analysis task or for a VLAN in a task. If there is more than
one VLAN for the selected task, this chart reflects traffic for all VLANs configured in a task.
By default, this graph displays statistics for the previous hour.
•
To view data for an earlier period, click the Previous button in the upper right corner of the chart.
•
To view data for a later period, click the Next button in the upper right corner of the chart.
Click Back to return to the main Application Category report page.
Figure 76 Application Category Report: Application Category Traffic Trend Report for an Individual
Application Category
TopN application category usage list for an individual application category
The TopN Application Category Usage List includes Source Host List and Destination Host List for an
individual protocol for all VLANs in the selected traffic analysis task or for VLAN in a task.
•
Source Host List provides a list of the TopN source hosts measured by volume of traffic observed on
all VLANs in the selected traffic analysis task or a VLAN in a task for the selected time range. This
list includes the source host IP address, total volume of traffic for the associated source and the
percentage of all observed traffic generated by the source.
•
Destination Host List provides a list of the TopN destination hosts measured by volume of traffic
observed on all VLANs in the selected traffic analysis task or a VLAN in a task for the selected time
range. This list includes the destination IP address, total volume of traffic for the associated
destination and the percentage of all observed traffic generated by the destination.