Protocol traffic trend, Individual protocol reports – H3C Technologies H3C Intelligent Management Center User Manual
Page 303
293
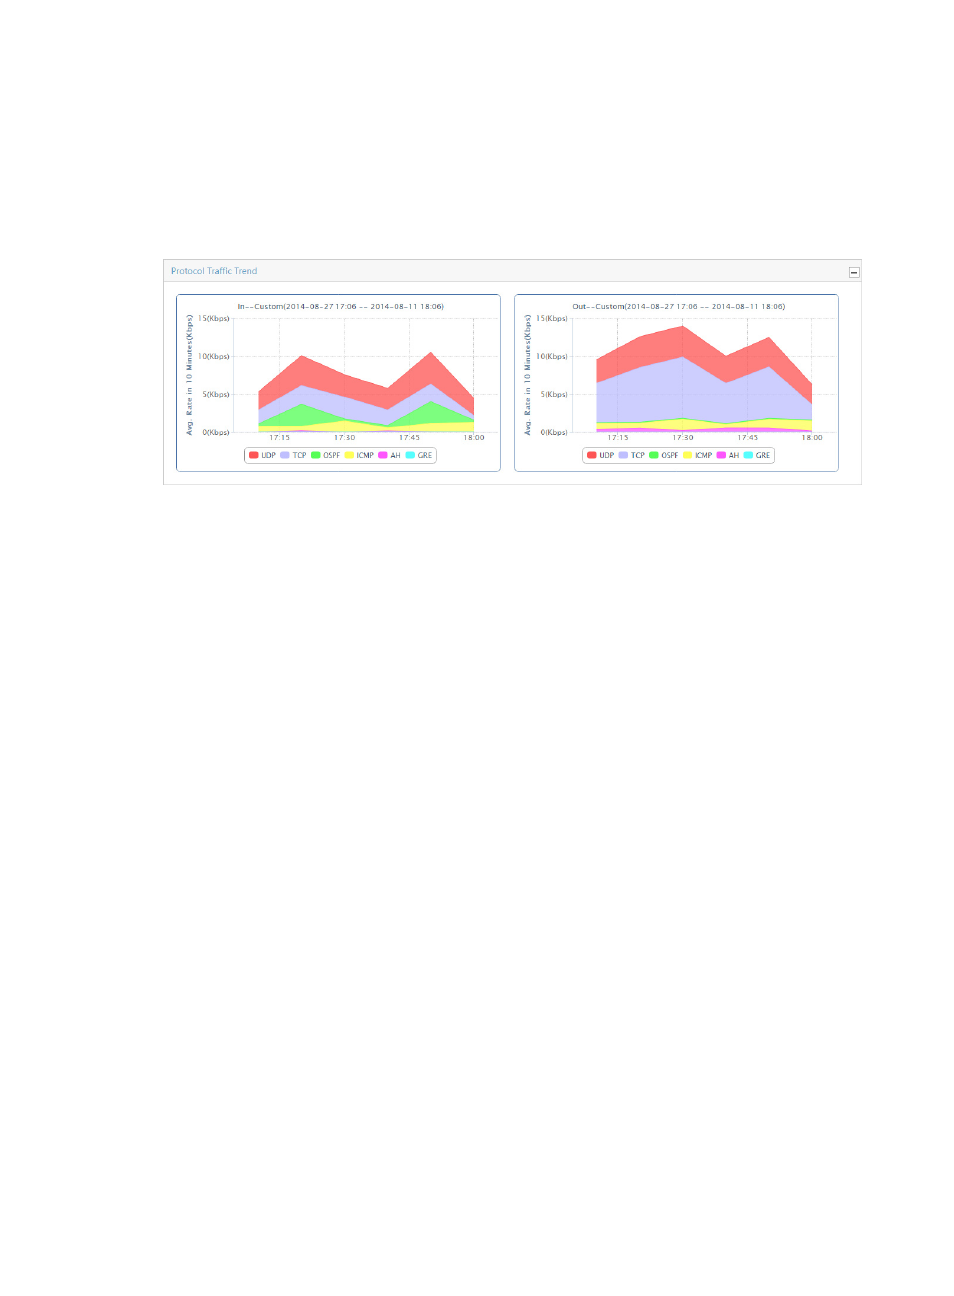
Protocol traffic trend
The Protocol Traffic Trend – In/Out stacked area chart provides average inbound/outbound traffic rates
for all protocols observed for all VPNs in the selected traffic analysis task for the selected time range. If
there is more than one VPN for the selected task, these statistics reflects traffic for all VPNs configured in
a task.
Figure 198 Application Report: Protocol Traffic Trend – In/Out
Individual protocol reports
NTA provides traffic trend statistics for the individual protocol that were observed on the VPNs for a
selected task. Individual protocol reports include the Protocol Traffic Trend report that displays the
average rate of traffic for the selected protocol. Individual protocol reports also include the TopN Protocol
Usage List for source and destination hosts, which identifies which source and destination hosts
contributed the greatest volume of traffic for the selected protocol.
To view individual protocol reports for a probe task, click the name in the Protocol field of the Protocol List
report for the protocol for which you want to view this report. For more information about Protocol List,
see "
Protocol traffic trend
The Protocol Traffic Trend — In/Out graph provides average rate of traffic for an individual protocol for
all VPNs in the selected traffic analysis task. If there is more than one VPN for the selected task, this chart
reflects traffic for all VPNs configured in a task.
By default, the Protocol Traffic Trend graph displays statistics for the previous hour.
•
To view data for an earlier period, click the Previous button located in the upper right corner of the
chart.
•
To view data for a later period, click the Next button located in the upper right corner of the chart.
•
Click Back to return to the main Protocol report page.