EXFO IQS-1500 Power Meters for IQS-500/600 User Manual
Page 59
Performing Acquisitions
Power Meters
51
Consulting Acquired Data
³
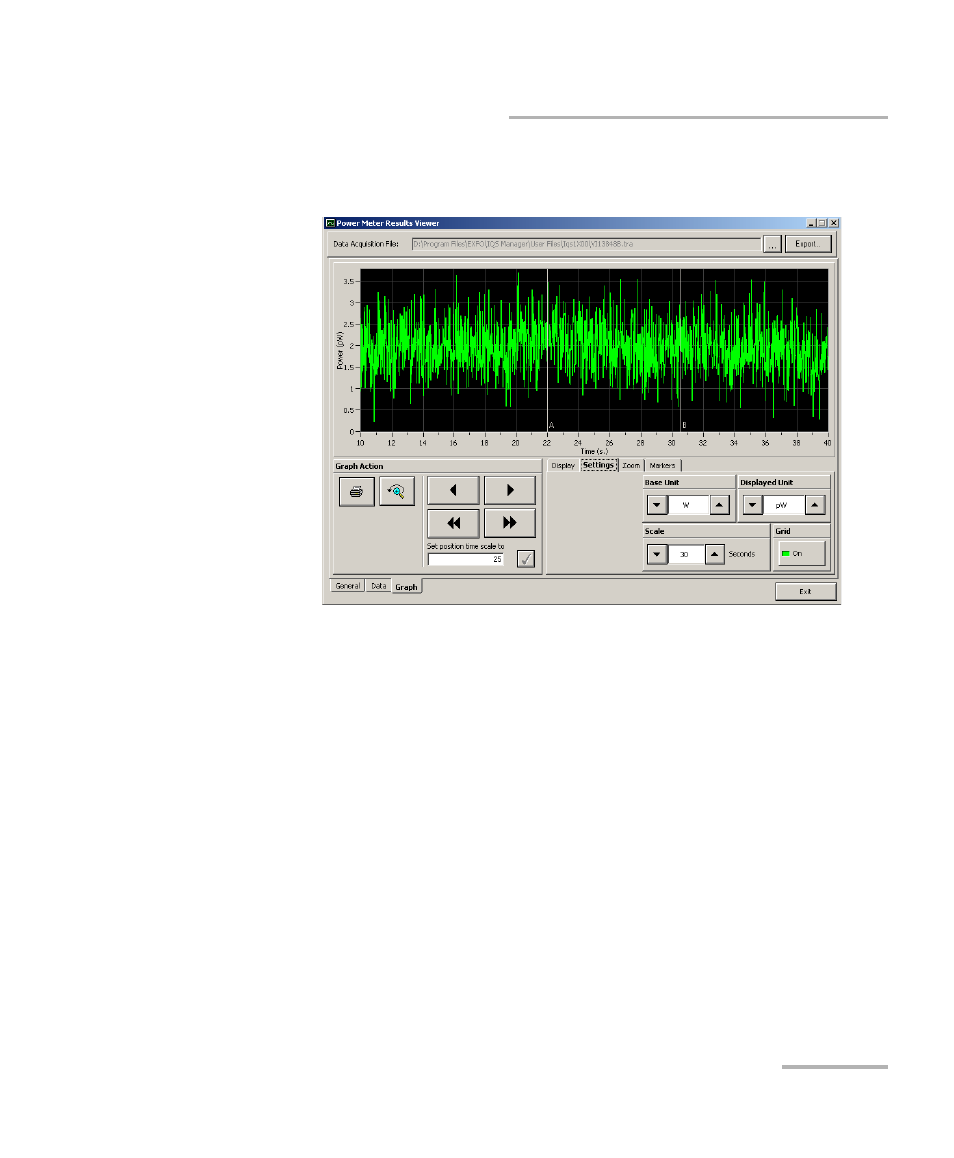
To view the graph corresponding to your acquisition data, select
the Graph tab.
To move along the time scale, use the arrow buttons.
The single arrow buttons will move by increments or decrements
representing 10 % of the current trace scale value.
The double arrow buttons will move by increments or
decrements of the current screen display (for example, the 10 to
40 seconds display would become 40 to 70 seconds in the figure
above).
To center on a specific value, type it in the Set position time scale
to box.
The other buttons and tabs are identical to those found in your
power meter application’s Graph tab. See Performing and
Analyzing Graph Acquisitions on page 53 for details.
This manual is related to the following products: