HP 48G User Manual
Page 81
Attention! The text in this document has been recognized automatically. To view the original document, you can use the "Original mode".
Lesson 27: Finding Slope, Tangents, and
Critical Points
The following examples
show you
other
kinds
of analysis
you can
|)erform on the currently plotted function.
Example,:
Using the same polynomial you just plotted in the
previous lesson (A'® + A"‘ — 5A® — 2A'“ + A' — 4), find the
slope at
X
= —0.4 and draw a tangent line to the function
at
X
= 0.3.
S t e p 1 :
Turn on TRACE mode and move the cursor using the
and © keys.
fNXT) (to redisplay the menu)
p ;|; f:
t
JRFlCE
@ and O as needed
,
,
.
A
1
S t e p 2 :
Display the cursor coordinates and move the cursor over
until the jecoordinate equals -0.4.
© or a as needed
,,,
A-
1
. . . . .
1 H
K: “.H
i: -H.aBHfiM
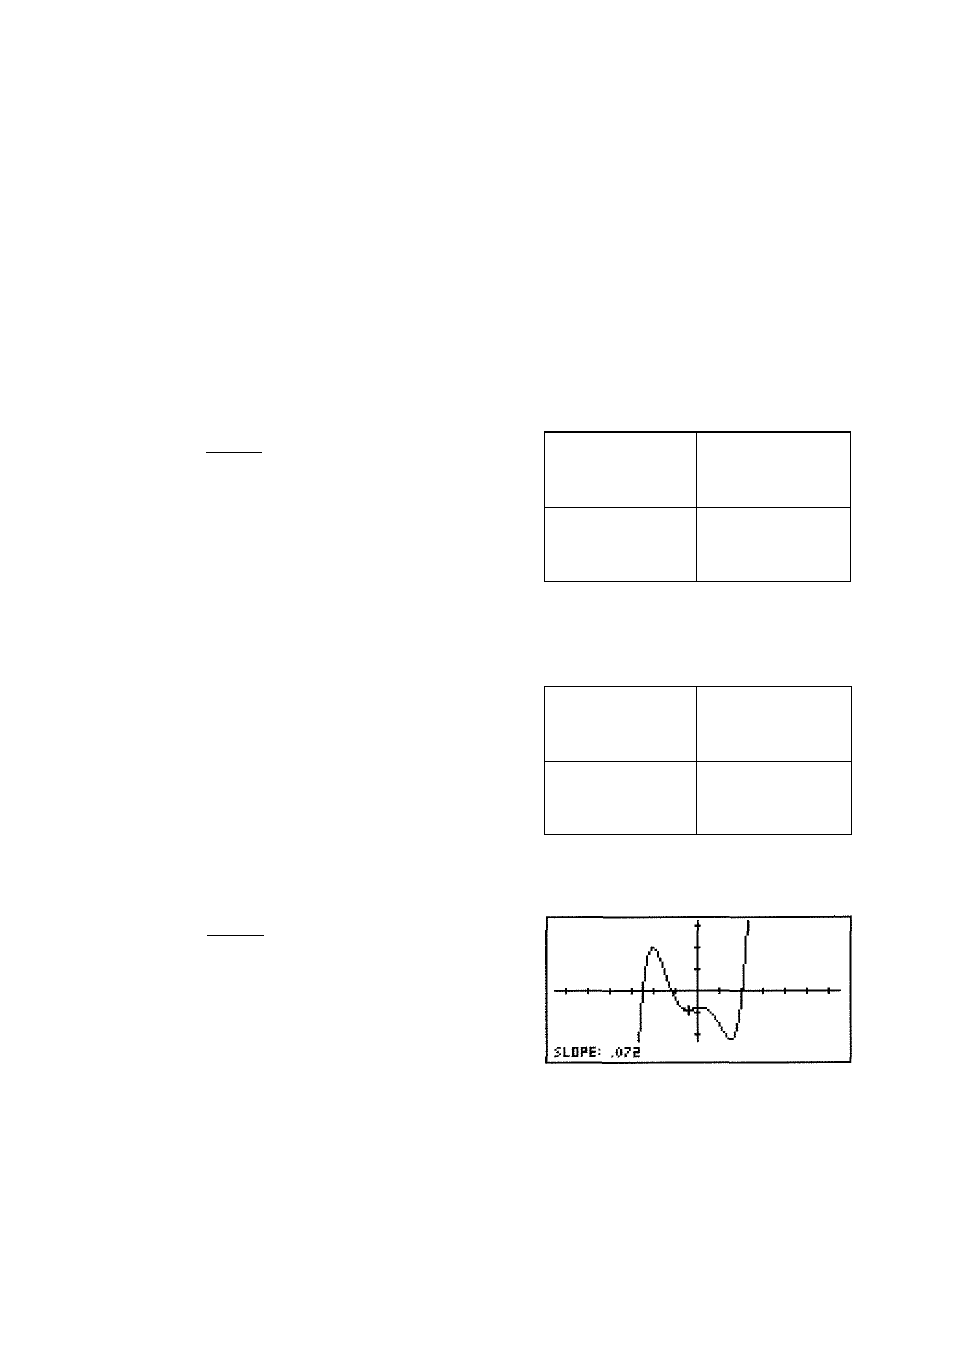
S t e p S :
Find the slope.
( N X T
) (to redisplay the
m e n u )
F C H S L. 0 P E
Plotting Equations and Analyzing Graphs 6-15