HP 48G User Manual
Page 78
Attention! The text in this document has been recognized automatically. To view the original document, you can use the "Original mode".
Plot Type and Description
Example
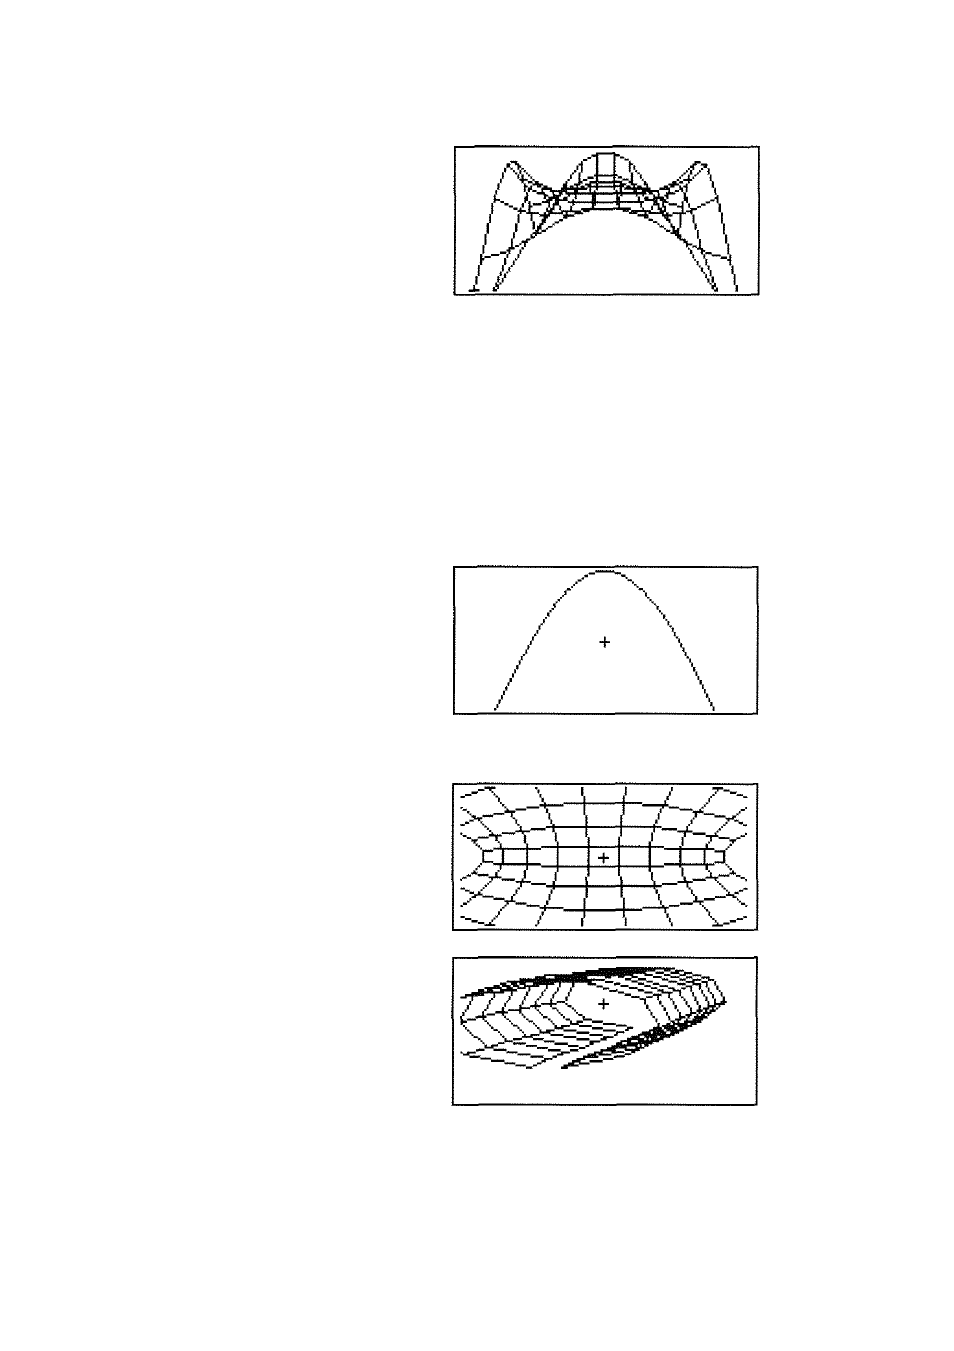
Wii'eframe
Plots a perspective, wireframe
view of tlie surface determined by
a
function of two
variables.
(Shown:
F
=
— 4 . / ’ ] /
+
y ^ )
HP 48 Plot Types (continued)
Pseudo-Contour
For a function.
F { x , y ) ,
plots a
lattice of line segments that are
each tangent to a contour of the
function (a curve
satisfying
{/(^constant). This allows
your
e y e
to pick out tlie contours
without actually plotting them.
(Shown:
F
= (,r" — l)/(j/' ^1))
Y-SUce
Plots a. series of cross-sections of
the surface determined by the
current function of two variables
and can create an animation of
them to help you visualize a
moving slice through the surface.
,-.4
— 4.1‘";!/■' + !/■*
(Shown:
F
Gridmap
Plots a rectilinear grid as it is
“distorted” under the mapping of
a complex-valued function
{ F ( x
-h
i f / ) ) .
(Shown:
F
= sin
( x
-|-
i y ) )
Parametric-Surface
Plots a perspective, wireframe
model of a parametrized surface
( F ( u , f ) =
x ( u , v ) i
-f
y (
U ,
v ) j
+
c(
ti,
tt)k).
(Shown:
x ( u , v ) ~
sin .3.c
+ \ y \
i . i
1-
i
y { u , v \
V ) =
C0S.3.C.)
6-12 Plotting Equations and Analyzing Graphs