Graph displays, Displays -3, Figure 5-3 rate vs. time graph -3 – INFICON MDC-360C Thin Film Deposition Controller User Manual
Page 87: Figure 5-4 rate deviation vs. time graph -3, Figure 5-5 thickness vs. time graph -3
MDC-360C DEPOSITION CONTROLLER
OPERATING THE MDC-360C
5-3
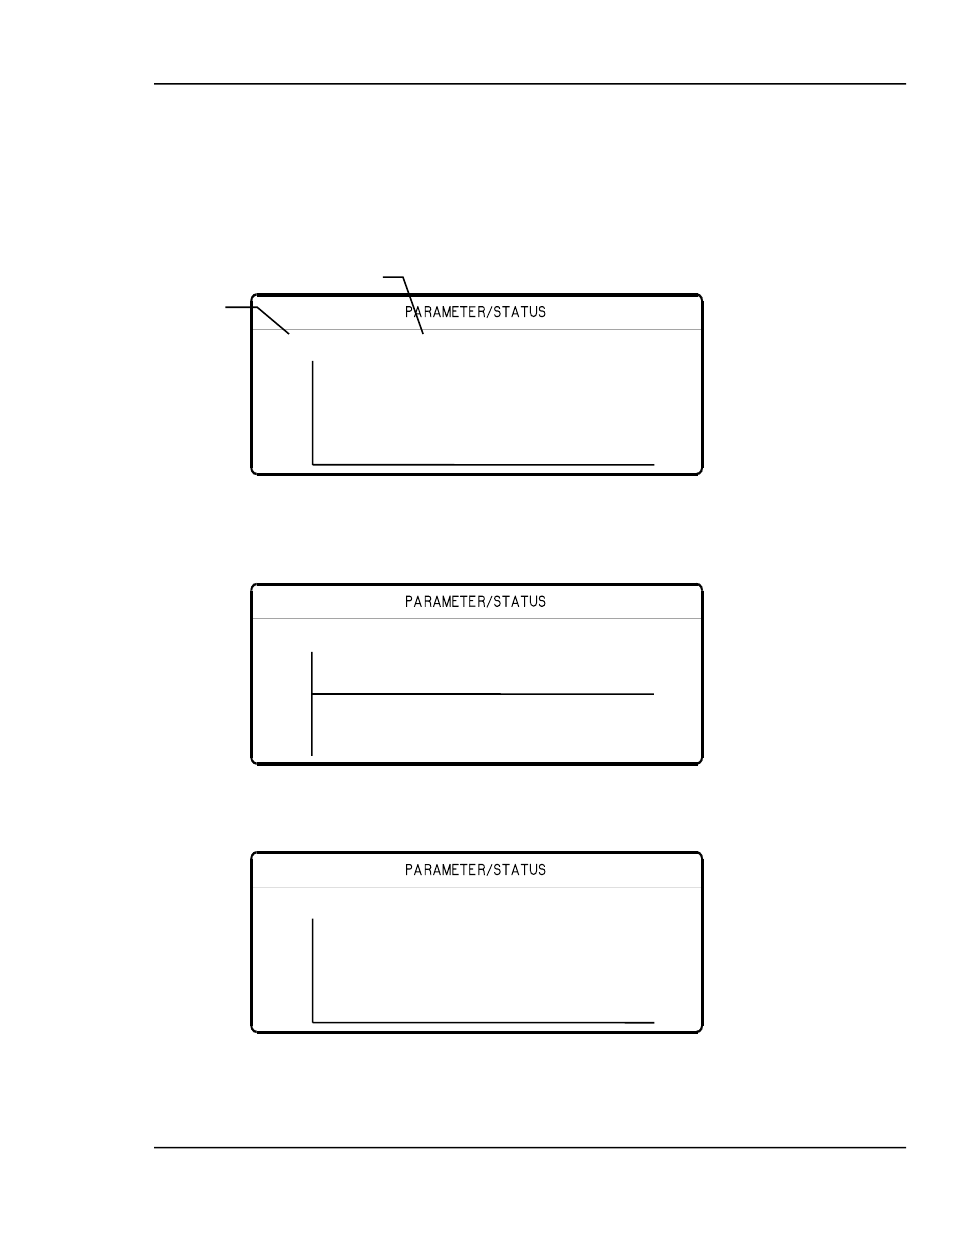
5.5 GRAPH
DISPLAYS
There are four different run time graph screens that can be displayed at any time
by pressing the Graph key (providing they have each been enabled in the Edit
Display Setup menu). The first key press will bring up the last viewed graph
screen, repeatedly pressing the Graph key will cycle through the four graph
screens, shown below.
Figure 5-3 Rate vs. Time Graph
Figure 5-4 Rate Deviation vs. Time graph
Figure 5-5 Thickness vs. Time Graph
Sample Cr Process Ready
10
Rate
0 1
Sample Cr Process Ready
5
Rate Dev%
1
5
Sample Cr Process Ready
999
Thickness
0 1
Displays the current
process name.
Displays the current
material name.
See also other documents in the category INFICON Equipment:
- TGF10 Tracer Gas Filler (36 pages)
- Sensistor ILS500 F Leak Detection Filler (90 pages)
- T-Guard Leak Detection Sensor (85 pages)
- T-Guard Leak Detection Sensor Interface description (40 pages)
- Sensistor ISH2000P Hydrogen Leak Detector, Panel Model (51 pages)
- Sensistor ISH2000 HySpeed Hydrogen Leak Detector (54 pages)
- LDS3000 Modular Leak Detector (52 pages)
- LDS3000 Modular Leak Detector Interface description (56 pages)
- BM1000 Bus module (14 pages)
- I/O1000 I/O module (18 pages)
- CU1000 Control unit (24 pages)
- Helium Leak Detector Modul1000 (130 pages)
- Helium Leak Detector Modul1000 Interface description (40 pages)
- UL5000 Dry Helium Leak Detector (108 pages)
- UL5000 Dry Helium Leak Detector Interface description (14 pages)
- UL1000 Fab Dry Helium Leak Detector (119 pages)
- HLD6000 Refrigerant Leak Detector (76 pages)
- HLD6000 Refrigerant Leak Detector Interface Description (40 pages)
- IO1000 I/O module (18 pages)
- Ecotec E3000 Multigas-Sniffer-Leak Detector (92 pages)
- Ecotec E3000 Multigas-Sniffer-Leak Detector Interface description (36 pages)
- Sensistor XRS9012 Hydrogen Leak Detector User Manual (28 pages)
- Sensistor XRS9012 Hydrogen Leak Detector Maintenance manual (14 pages)
- Extrima Ex-certified Hydrogen Leak Detector (62 pages)
- Sensistor ILS500 Leak Detection System (107 pages)
- Sensistor ISH2000 Hydrogen Leak Detector (58 pages)
- Sensistor ISH2000 Hydrogen Leak Detector (108 pages)
- Sensistor Sentrac Hydrogen Leak Detector (86 pages)
- Protec P3000(XL) Helium Leak Detector (132 pages)
- Pilot Plus Vacuum Gauge (2 pages)
- CO Check Carbon Monoxide Meter (2 pages)
- GAS-Mate Combustible Gas Leak Detector (12 pages)
- Whisper Ultrasonic Leak Detector (8 pages)
- Vortex AC Refrigerant Recovery Machine 115V (20 pages)
- Vortex AC Refrigerant Recovery Machine 230V (16 pages)
- Wey-TEK Refrigerant Charging Scale & Optional Charging Module (2 pages)
- Wey-TEK Refrigerant Charging Scale & Optional Charging Module (44 pages)
- D-TEK CO2 Refrigerant Leak Detector (12 pages)
- TEK-Mate Refrigerant Leak Detector (12 pages)
- Compass Refrigerant Leak Detector (12 pages)
- D-TEK Select Refrigerant Leak Detector (12 pages)
- Explorer Portable Gas Chromatograph (369 pages)
- MicroFID II Portable Flame Ionization Detector (89 pages)
- DataFID Portable Flame Ionization Detector for Landfill Emissions Monitoring (91 pages)
- Hydrostik Hydrogen Fuel Cylinder Installation (7 pages)