1 phase compensation flow diagram, An366, Figure 36. meter test equipment – Cirrus Logic AN366 User Manual
Page 40: Current voltage
AN366
40
AN366REV2
6.2.1 Phase Compensation Flow Diagram
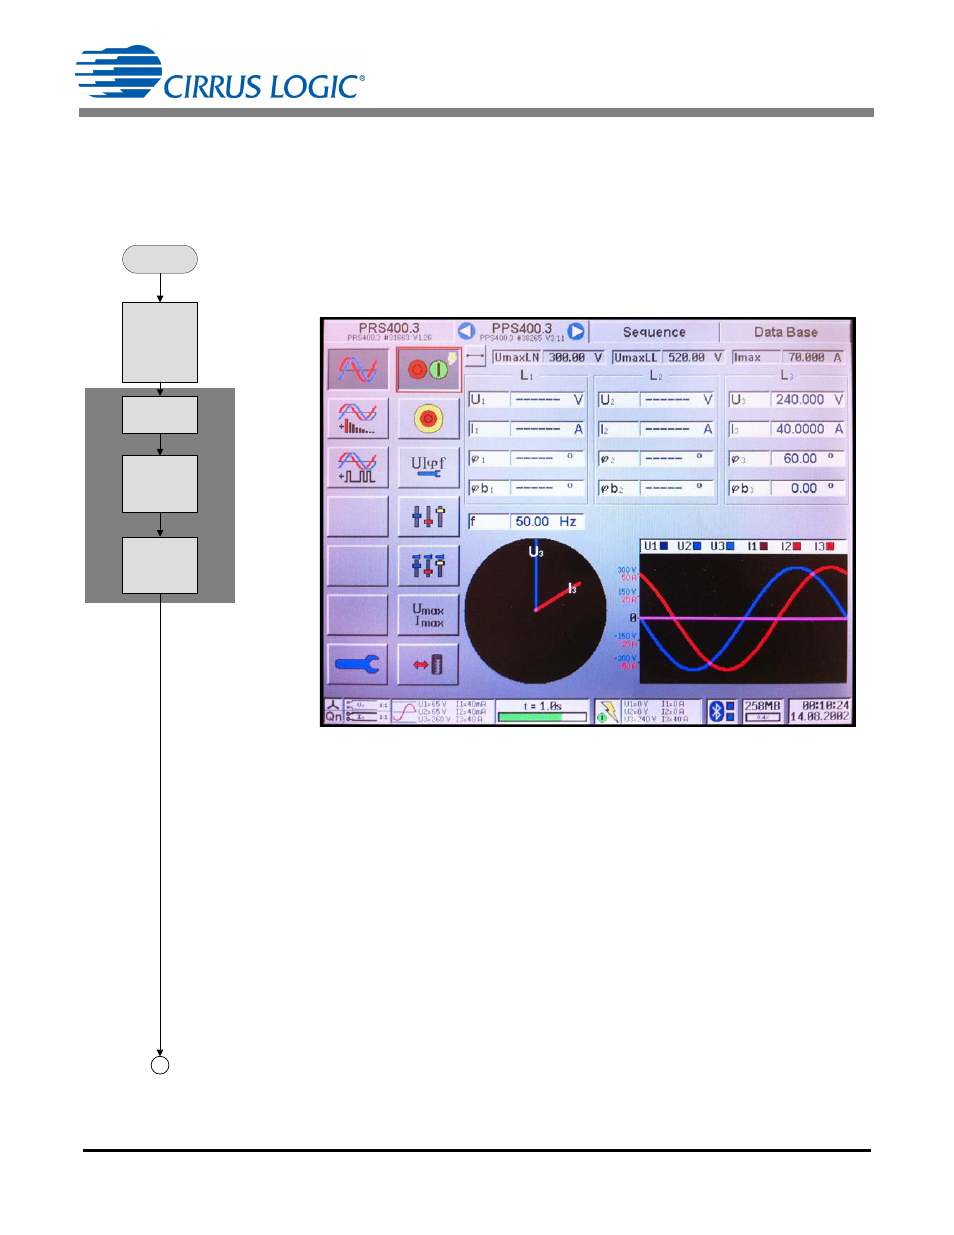
The following flow diagram shows the implemented of phase compensation using the CDB5484U and a PC
as the controller. The MTE Meter Test Equipment source is used to provide the source voltage and load current
with a 60º phase shift (PF = 0.5). Each step of the flow shows the CDB5484 GUI screen capture of execution
and reading results. The register writes and reads are all identified for easy compares to the GUI screen.
APPLY VOLTAGE AND 60* LAGGING LOAD TO SOURCE
(See Figure 36.)
Figure 36. Meter Test Equipment
APPLY VOLTAGE
TO SOURCE &
60º LAGGING
LOAD
PF=0.5
FROM MAIN
FLOW
Tsettle =
2000ms
SampleCount
(N) = 16,000
Shown
In
Main
Flow
1
START
CONTINUOUS
CONVERSION
0xD5
Current
Voltage
See also other documents in the category Cirrus Logic Hardware:
- CobraNet (147 pages)
- CS4961xx (54 pages)
- CS150x (8 pages)
- CS1501 (16 pages)
- CS1601 (2 pages)
- CS1601 (16 pages)
- CS1610 (16 pages)
- CRD1610-8W (24 pages)
- CRD1611-8W (25 pages)
- CDB1610-8W (21 pages)
- CS1610A (18 pages)
- CDB1611-8W (21 pages)
- CDB1610A-8W (21 pages)
- CDB1611A-8W (21 pages)
- CRD1610A-8W (24 pages)
- CRD1611A-8W (25 pages)
- CS1615 (16 pages)
- AN403 (15 pages)
- AN401 (14 pages)
- AN400 (15 pages)
- AN375 (27 pages)
- AN376 (9 pages)
- CRD1615-8W (22 pages)
- CRD1616-8W (23 pages)
- AN402 (14 pages)
- AN404 (15 pages)
- CRD1615A-8W (21 pages)
- CS1615A (16 pages)
- CS1630 (56 pages)
- AN374 (35 pages)
- AN368 (80 pages)
- CRD1630-10W (24 pages)
- CRD1631-10W (25 pages)
- CS1680 (16 pages)
- AN405 (13 pages)
- AN379 (31 pages)
- CRD1680-7W (31 pages)
- AN335 (10 pages)
- AN334 (6 pages)
- AN312 (14 pages)
- AN Integrating CobraNet into Audio Products (16 pages)
- CobraNet Audio Routing Primer (9 pages)
- Bundle Assignments in CobraNet Systems (3 pages)
- CS2300-01 (3 pages)
- CS2000-CP (38 pages)