Graph menu – WIKA Pascal ET User Manual
Page 64
6 Commissioning, operation
64 WIKA Operating Instruction, Pascal ET and Pascal ET/IS
GB
6.4.7 Graph Menu
To display the behavior of a variable associated to a channel in a certain range of time, press
GRAPHIC inside the active menu. The box SETUP is displayed in the new menu, enabling the
selection of the following parameters:
Sampling time (hh, mm, ss)
Scale (automatic, manual)
Lower limit (in manual)
Upper limit (in manual)
X Axis (fixed or tracked to cursor)
Select the values with the arrows and then press START. The graphic will be visualized on the
display, as per the figure
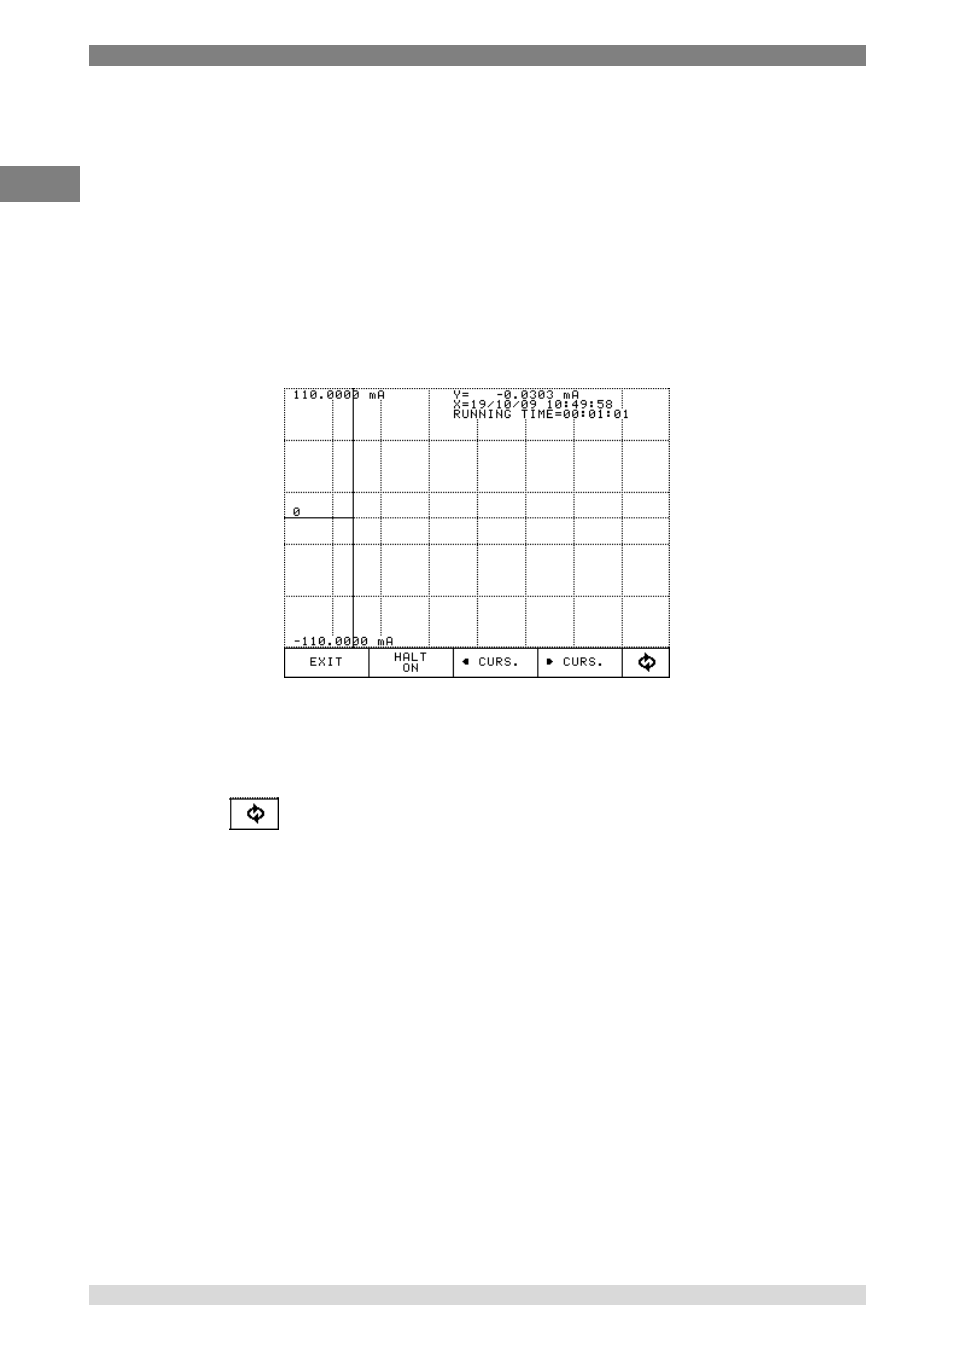
Figure 69
– Realtime graph
Through the box CURS. the cursor can be moved, visualizing for every step the value of the
graphic. Pressing INFO OFF all the displayed information will be hidden, while with GRID OFF the
grid will be hidden. Both the information and the grid can be displayed again pushing the related
buttons.
Through the box
(circle with arrows) in the bottom right side of the menu,
it’s possible to
acces to all other menu not shown on this screen.