Agilent Technologies Agilent 4396B User Manual
Page 83
7.
Press
NNNNNNNNNNNNNNNNNNNNNNNNNNNNNNNNNNNNNNNNNNNNNNN
DATA
HOLD
[MAX]
NNNNNNNNNNN
MIN
and
then
wait
for
a
few
sweeps
until
the
trace
is
stable
.
The
minimum
envelope
is
displayed.
8.
Press
4
Ma
rk
er
5
N
NNNNNNNNNNNNNNNNNNNNNNNNNNNNNNNNNNNNNNNN
MKR
ON
[DATA]
to
N
NNNNNNNNNNNNNNNNNNNNNNNNN
[MEMORY]
.
Then
turn
the
knob
to
move
the
marker
to
the
desired
position
to
measure
the
frequency
deviation.
9.
Press
NNNNNNNNNNNNNNNNNNNNNNNNNNNNNNNN
1MODE
MENU
NNNNNNNNNNNNNNNNNNNNNNNNNNNNNNNN
FIXED
1MKR
.
10.
Press
NNNNNNNNNNNNNNNNNNNN
RETURN
NNNNNNNNNNNNNNNNNNNNNNNNNNNNNNNNNNNNNNNNNNNNNNN
MKR
ON
[MEMORY]
to
NNNNNNNNNNNNNNNNNNNN
[DATA]
.
Then
turn
the
knob
to
move
the
marker
to
the
position
that
is
the
same
value
as
the
xed
1marker
value
.
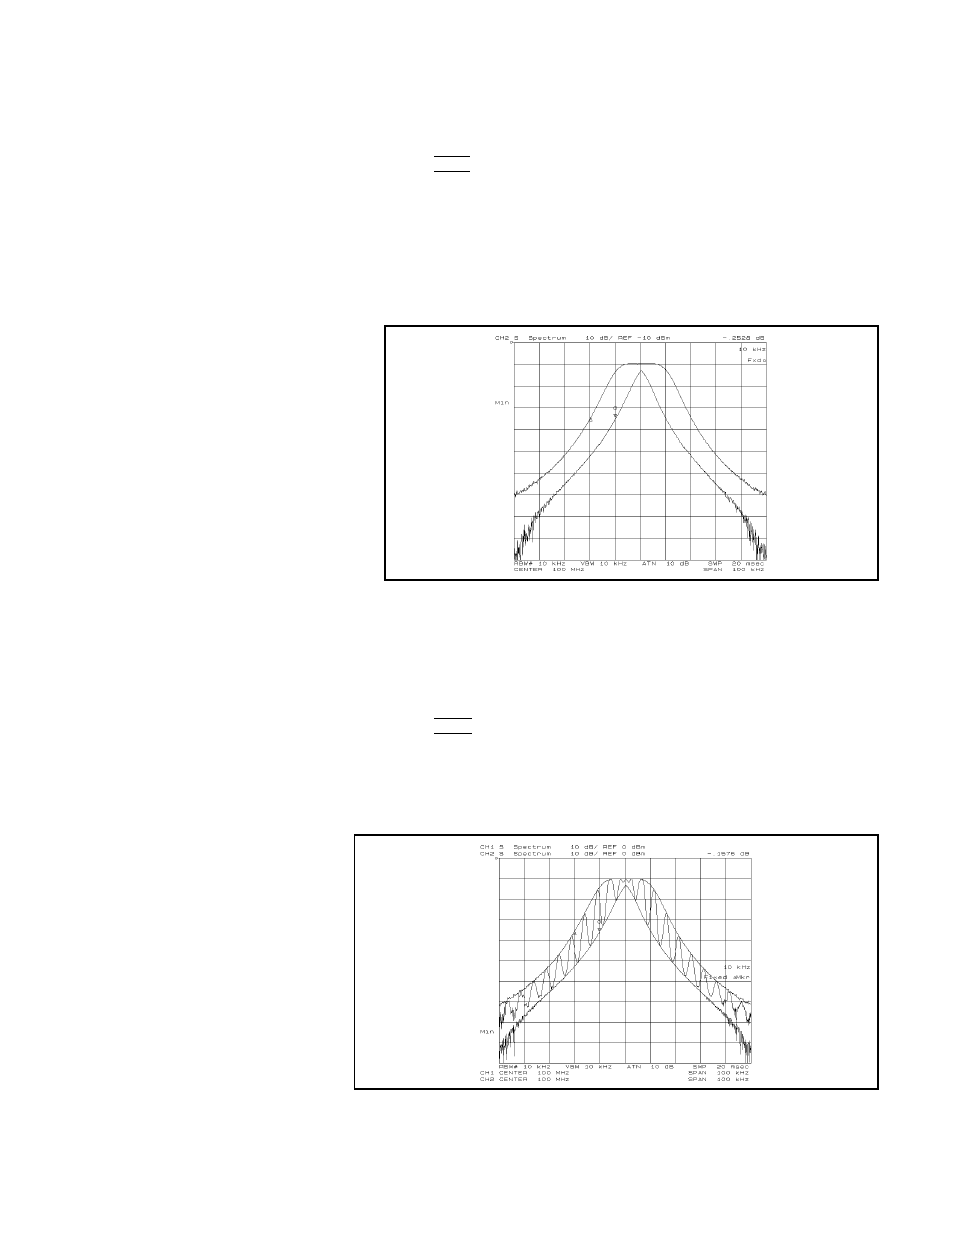
Figure
4-17.
Maximum
and
Minimum
Envelopes
of
Narrow
Band
FM
Signal
The
frequency
deviation
(1f
peak
)
can
be
derived
from
the
same
equation
that
is
used
for
the
wide
band
FM
signal.
In
this
example
,
1f
peak
can
be
derived
to
be
5
kHz.
11.
Press
4
Displa
y
5
NNNNNNNNNNNNNNNNNNNNNNNNNNNNNNNNNNNNNNNNNNNNNNNNNN
DUAL
CHAN
on
OFF
to
NNNNNNNNNNNNNNNNNNNN
ON
off
.
Both
the
spectrum
and
its
envelope
are
displayed
on
the
split
display
.
12.
Press
NNNNNNNNNNNNNN
MORE
NNNNNNNNNNNNNNNNNNNNNNNNNNNNNNNNNNNNNNNNNNNNNNNNNNNNN
SPLIT
DISP
ON
off
to
NNNNNNNNNNNNNNNNNNNN
on
OFF
.
The
analyzer
superimposes
the
spectrum
on
the
envelopes
as
shown
in
Figure
4-18.
Figure
4-18.
Superimposing
Spectrum
and
Envelopes
Spectrum
Measurement
Examples
4-15