6 pie chart tab, 1 popup display, 7 options tab – Allied Telesis AT-VIEW PLUS 3.2 DEVICE MANAGER User Manual
Page 89: 6 pie chart tab 7.2.7 options tab, Pie chart tab, Options tab
Allied Telesyn
AT-VIEW PLUS
DEVICE MANAGER
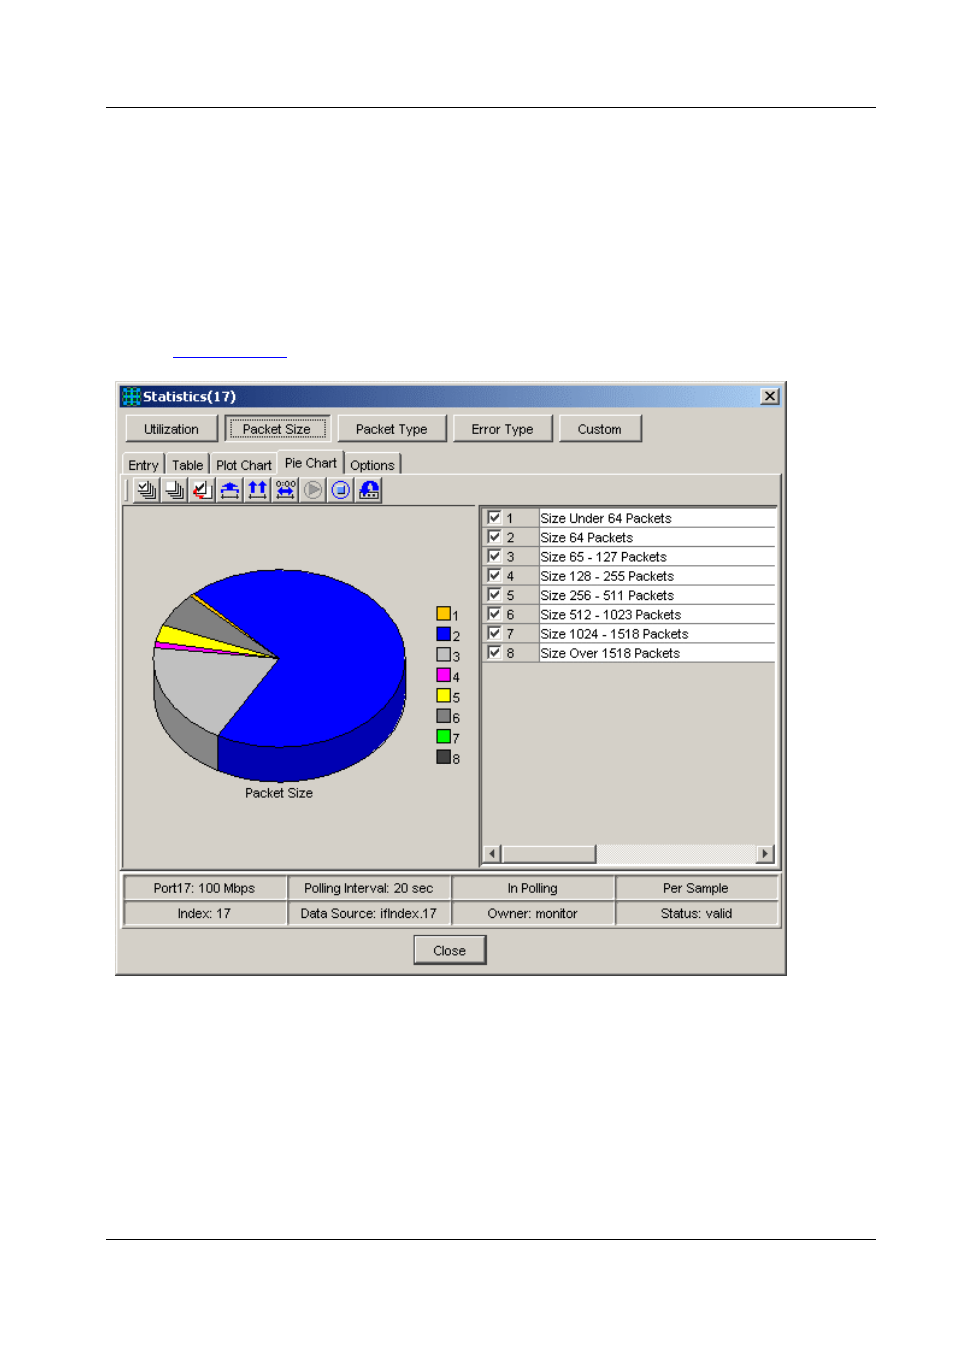
7.2.6 Pie Chart Tab
In the Pie Chart tab, network statistics are shown in a pie chart. This chart is useful for checking
the proportions of the various packet counts. The data is updated at the polling interval.
Note
- The pie chart is not displayed when all data has the value zero.
Topics:
•
RMON Statistics 3-D Pie Chart tab
7.2.6.1 Popup Display
When you move the mouse cursor onto a section of the pie chart, the value of the data for the
selected area is displayed.
7.2.7 Options Tab
In the Options tab, you can customize the display options or edit the statistics data.
PN 613-50664-00 Rev C
Page 89 of 119
See also other documents in the category Allied Telesis Computer hardware:
- AT-GS908M (54 pages)
- AT-x230-10GP (80 pages)
- AT-GS950/48PS (64 pages)
- AT-GS950/10PS (386 pages)
- AT-GS950/16PS (386 pages)
- AT-GS950/48PS (386 pages)
- AT-9000 Series (258 pages)
- AT-9000 Series (1480 pages)
- IE200 Series (70 pages)
- AT-GS950/48 (410 pages)
- AT-GS950/8 (52 pages)
- AT-GS950/48 (378 pages)
- AT-GS950/48 (60 pages)
- SwitchBlade x8106 (322 pages)
- SwitchBlade x8112 (322 pages)
- SwitchBlade x8106 (240 pages)
- SwitchBlade x8112 (240 pages)
- AT-TQ Series (172 pages)
- AlliedWare Plus Operating System Version 5.4.4C (x310-26FT,x310-26FP,x310-50FT,x310-50FP) (2220 pages)
- FS970M Series (106 pages)
- 8100L Series (116 pages)
- 8100S Series (140 pages)
- x310 Series (116 pages)
- x310 Series (120 pages)
- AT-GS950/24 (404 pages)
- AT-GS950/24 (366 pages)
- AT-GS950/16 (44 pages)
- AT-GS950/16 (404 pages)
- AT-GS950/16 (364 pages)
- AT-GS950/8 (52 pages)
- AT-GS950/8 (404 pages)
- AT-GS950/8 (364 pages)
- AT-8100 Series (330 pages)
- AT-8100 Series (1962 pages)
- AT-FS970M Series (330 pages)
- AT-FS970M Series (1938 pages)
- SwitchBlade x3106 (288 pages)
- SwitchBlade x3112 (294 pages)
- SwitchBlade x3106 (260 pages)
- SwitchBlade x3112 (222 pages)
- AT-S95 CLI (AT-8000GS Series) (397 pages)
- AT-S94 CLI (AT-8000S Series) (402 pages)
- AT-IMC1000T/SFP (23 pages)
- AT-IMC1000TP/SFP (24 pages)
- AT-SBx3106WMB (44 pages)