5 plot chart tab, 1 popup display, Plot chart tab – Allied Telesis AT-VIEW PLUS 3.2 DEVICE MANAGER User Manual
Page 88
Allied Telesyn
AT-VIEW PLUS
DEVICE MANAGER
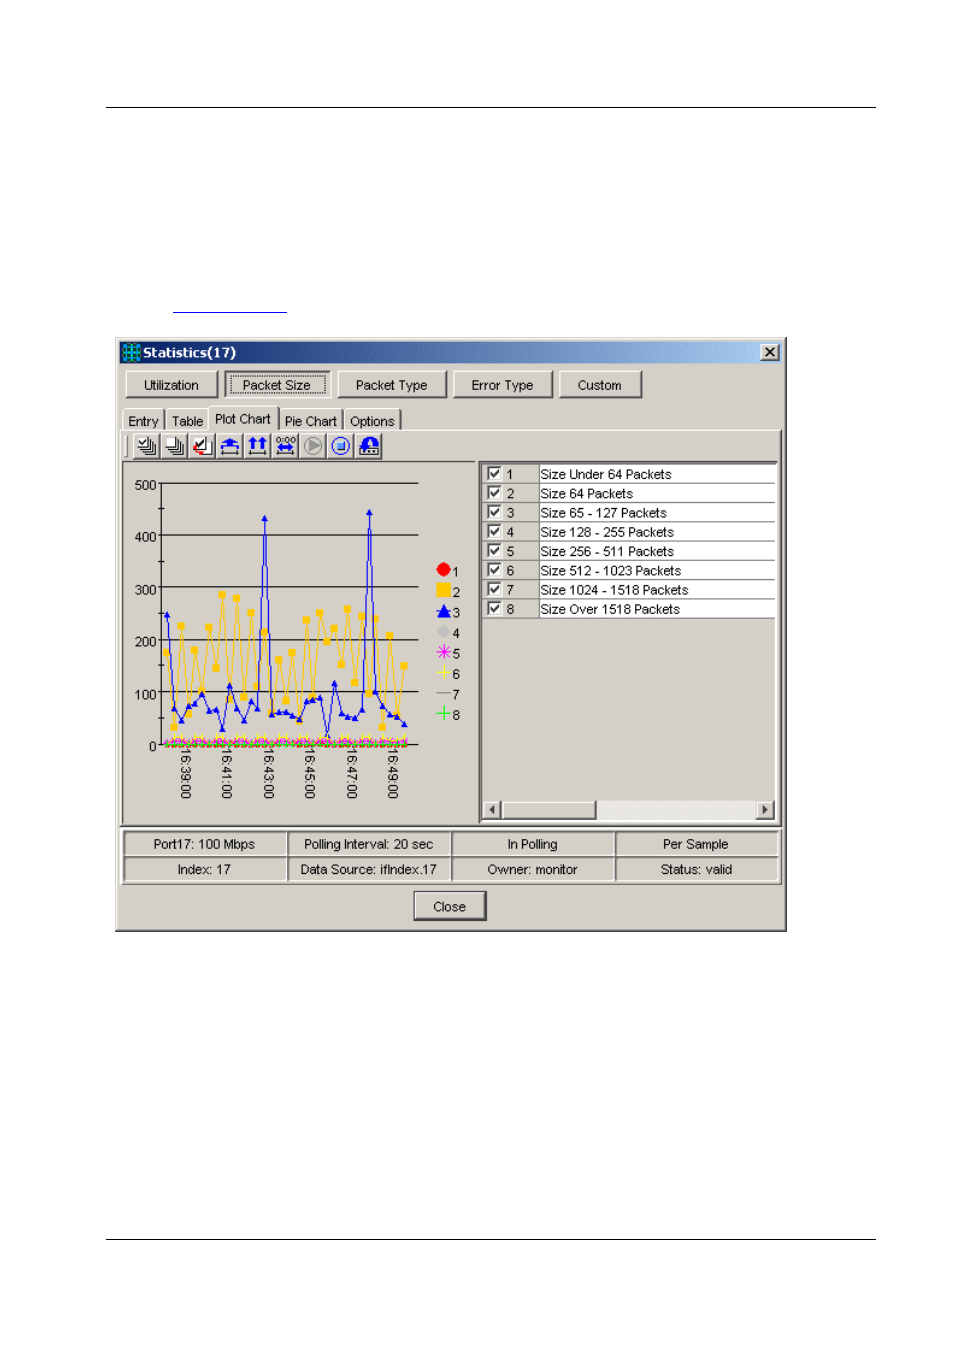
7.2.5 Plot Chart Tab
In the Plot Chart tab, network statistics are shown in the time-scaled plotting graph. Data is
updated at the polling interval. The horizontal axis contains a maximum of the 40 latest values.
Topics:
•
RMON Statistics Plot Chart tab
7.2.5.1 Popup Display
You can see the exact value of a plotted dot by moving the mouse cursor onto the dot. The values
are displayed in the form "(x, y)". where x indicates the time elapsed after the RMON window is
opened and y indicates the value of the data.
Below the graph's horizontal axis, time is displayed. Note that the times shown there are only for
your reference. They are not synchronized with the polling interval plotted dots.
PN 613-50664-00 Rev C
Page 88 of 119
- AT-GS908M (54 pages)
- AT-x230-10GP (80 pages)
- AT-GS950/48PS (64 pages)
- AT-GS950/10PS (386 pages)
- AT-GS950/16PS (386 pages)
- AT-GS950/48PS (386 pages)
- AT-9000 Series (258 pages)
- AT-9000 Series (1480 pages)
- IE200 Series (70 pages)
- AT-GS950/48 (410 pages)
- AT-GS950/8 (52 pages)
- AT-GS950/48 (378 pages)
- AT-GS950/48 (60 pages)
- SwitchBlade x8106 (322 pages)
- SwitchBlade x8112 (322 pages)
- SwitchBlade x8106 (240 pages)
- SwitchBlade x8112 (240 pages)
- AT-TQ Series (172 pages)
- AlliedWare Plus Operating System Version 5.4.4C (x310-26FT,x310-26FP,x310-50FT,x310-50FP) (2220 pages)
- FS970M Series (106 pages)
- 8100L Series (116 pages)
- 8100S Series (140 pages)
- x310 Series (116 pages)
- x310 Series (120 pages)
- AT-GS950/24 (404 pages)
- AT-GS950/24 (366 pages)
- AT-GS950/16 (44 pages)
- AT-GS950/16 (404 pages)
- AT-GS950/16 (364 pages)
- AT-GS950/8 (404 pages)
- AT-GS950/8 (364 pages)
- AT-GS950/8 (52 pages)
- AT-8100 Series (330 pages)
- AT-8100 Series (1962 pages)
- AT-FS970M Series (330 pages)
- AT-FS970M Series (1938 pages)
- SwitchBlade x3106 (288 pages)
- SwitchBlade x3112 (294 pages)
- SwitchBlade x3106 (260 pages)
- SwitchBlade x3112 (222 pages)
- AT-S95 CLI (AT-8000GS Series) (397 pages)
- AT-S94 CLI (AT-8000S Series) (402 pages)
- AT-IMC1000T/SFP (23 pages)
- AT-IMC1000TP/SFP (24 pages)
- AT-SBx3106WMB (44 pages)