Enter plot title, Choose axis information, Choose line/bar – DAVIS WeatherLink for Windows 4.0 User Manual
Page 77
U
S I N G
T H E
S
O F T W A R E
Using the Plot Window
68
Enter Plot Title
You may enter a plot title into the Plot Title text box at the top of the window. You
may also choose Edit Title from the Options sub-menu in the Plot menu to move
the cursor to the Title text box.
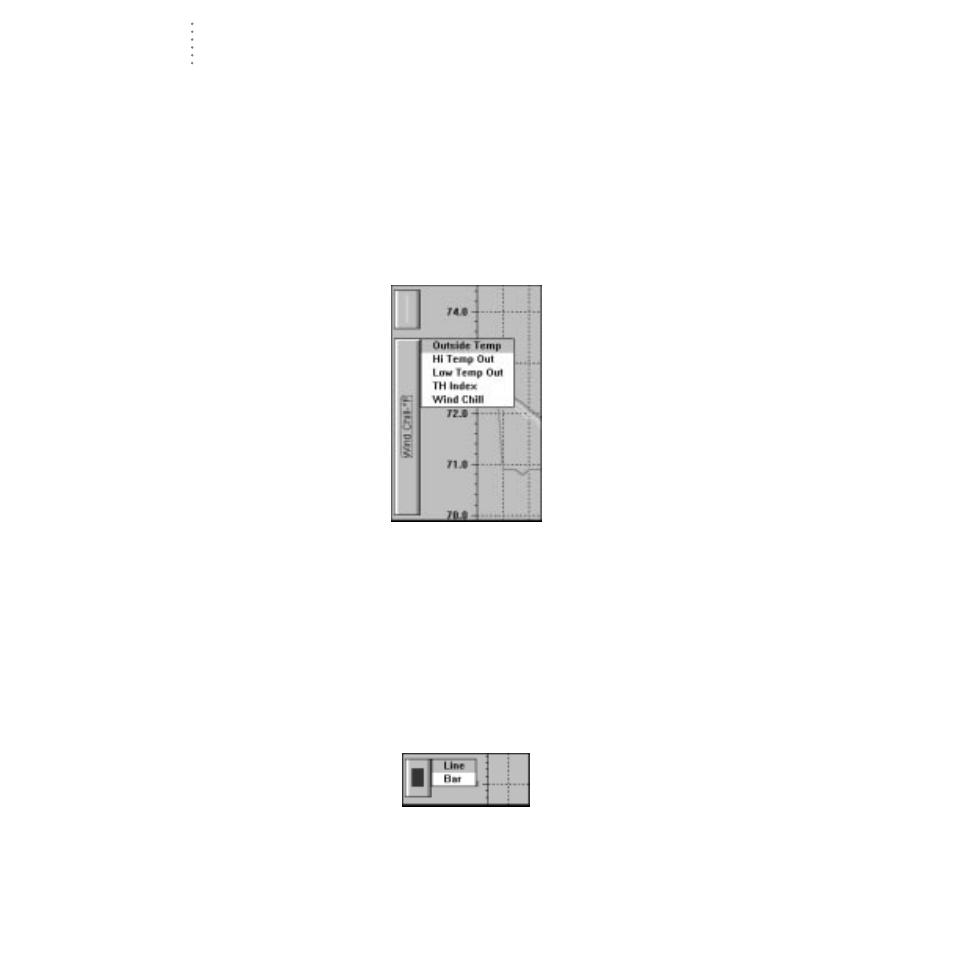
Choose Axis Information
Although you may have as many variables as desired on any plot, each axis (left/
right) on a plot may only display information for one of those variables. To choose
the axis information you want displayed, click on the desired Axis Info button or
choose the desired Variable command from the Options sub-menu in the Plot
menu. A pop-up list appears, containing the name (and color) of the variables on
this plot. Select the desired variable from the pop-up list.
A
XIS
I
NFO
P
OP
-U
P
L
IST
Choose Line/Bar
A line plot shows a line drawn from one data point to another until the whole plot
span is filled. A bar graph, on the other hand, shows cumulative totals during a
specific interval (each day on week and month plots, each month on year plots).
You may only use bar graphs for rainfall and only on plot spans of a week, month,
or year.
To select either a bar or line graph, click on the Line/Bar button or choose the
Line/Bar option for the desired axis from the Options sub-menu in the Plot menu.
A pop-up list appears next to the Line/Bar button. Choose either Line or Bar from
the list.
L
INE
/B
AR
P
OP
-U
P
L
IST