Lissajous meter display, Signaltools display options, Phase meter display – Avid Technology Pro Tools HD 7.2 User Manual
Page 91
Chapter 7: Plug-in Features and Enhancements
85
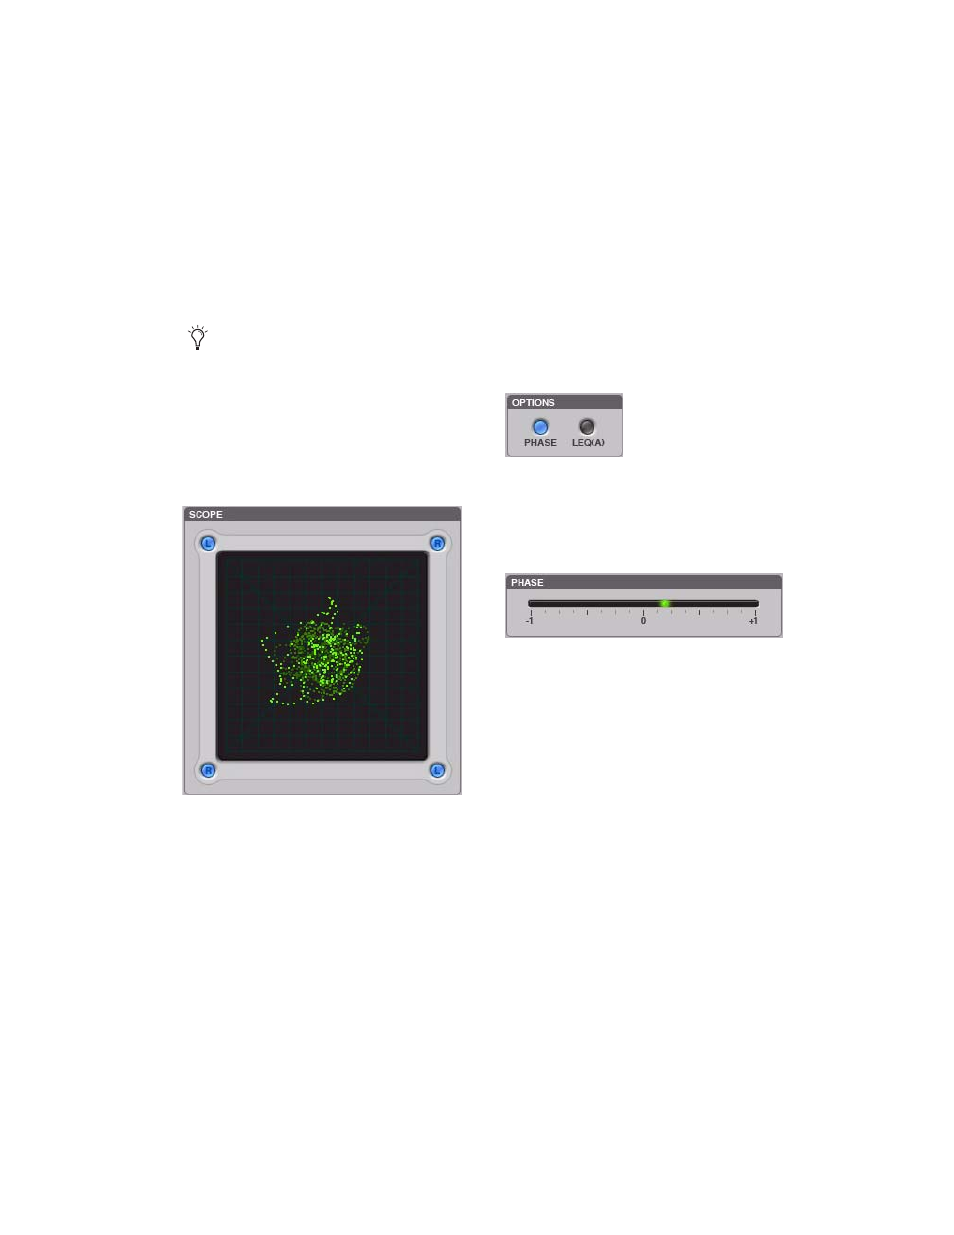
Lissajous Meter Display
The PhaseScope Lissajous Meter displays the re-
lationship between the amplitude and phase of
a stereo signal, enabling you to monitor stereo
imaging graphically.
The Lissajous Meter display is divided into four
quadrants, with left and right channels arranged
diagonally. When audio is panned predomi-
nantly to a particular speaker channel, a diago-
nal line appears, indicating the channel.
The Lissajous Meter displays in-phase material
as a vertical line and out-of-phase material as a
horizontal line.
SignalTools Display Options
Both SignalTools plug-ins offer two display op-
tions: Phase Meter Display and Leq(A) Meter
Display.
To choose a display option:
■
Click the corresponding button in the Op-
tions section of the plug-in window.
Phase Meter Display
The Phase Meter indicates the phase coherency
of two channels of a multi-channel signal.
The Phase Meter is green when the channels are
positively out of phase (values from 0 to +1) and
red when the channels are negatively out of
phase (values from 0 to –1).
At the center or zero position, the signal is a per-
fect stereo image. At the +1 position, the signal
is a perfect mono image. At the –1 position, the
signal is 100% out of phase.
A “Lissajous curve” (also known as a Lissa-
jous figure or Bowditch curve) is a type of
graph that is able to describe complex har-
monic motion. To learn more, search the
Web or your local library for information on
its origins and its two principal developers,
Jules Antoine Lissajous, and Nathaniel
Bowditch.
PhaseScope Lissajous Meter Display
SignalTools display options
SignalTools Phase Meter