HP XP Performance Advisor Software User Manual
Page 64

9.
Select the Add new RAID Groups, Ports to this schedule check box, if you want the performance
data collection schedule to automatically collect the performance data for the new RAID groups
or the ports that are discovered during the scheduled configuration data collection. If the Add
new RAID Groups, Ports to this schedule check box is selected in the first schedule, it is
automatically disabled in the second schedule.
However, the new ThP, snapshot, continuous access journal volumes, and the external RAID
groups are automatically added to that performance data collection schedule, which is already
collecting data for other virtual volumes that belong to the same XP or P9000 disk array. For
more information on adding newly discovered RAID groups, ports, ThP, snapshot, continuous
access journal volumes, and the external RAID groups, see
“Enabling performance collection
schedules for automatic updates” (page 65)
10. Click Save for the changes to take effect.
Click Cancel, if you do not want to configure a schedule for the current selection.
Click Refresh to view the updated list of performance data schedules.
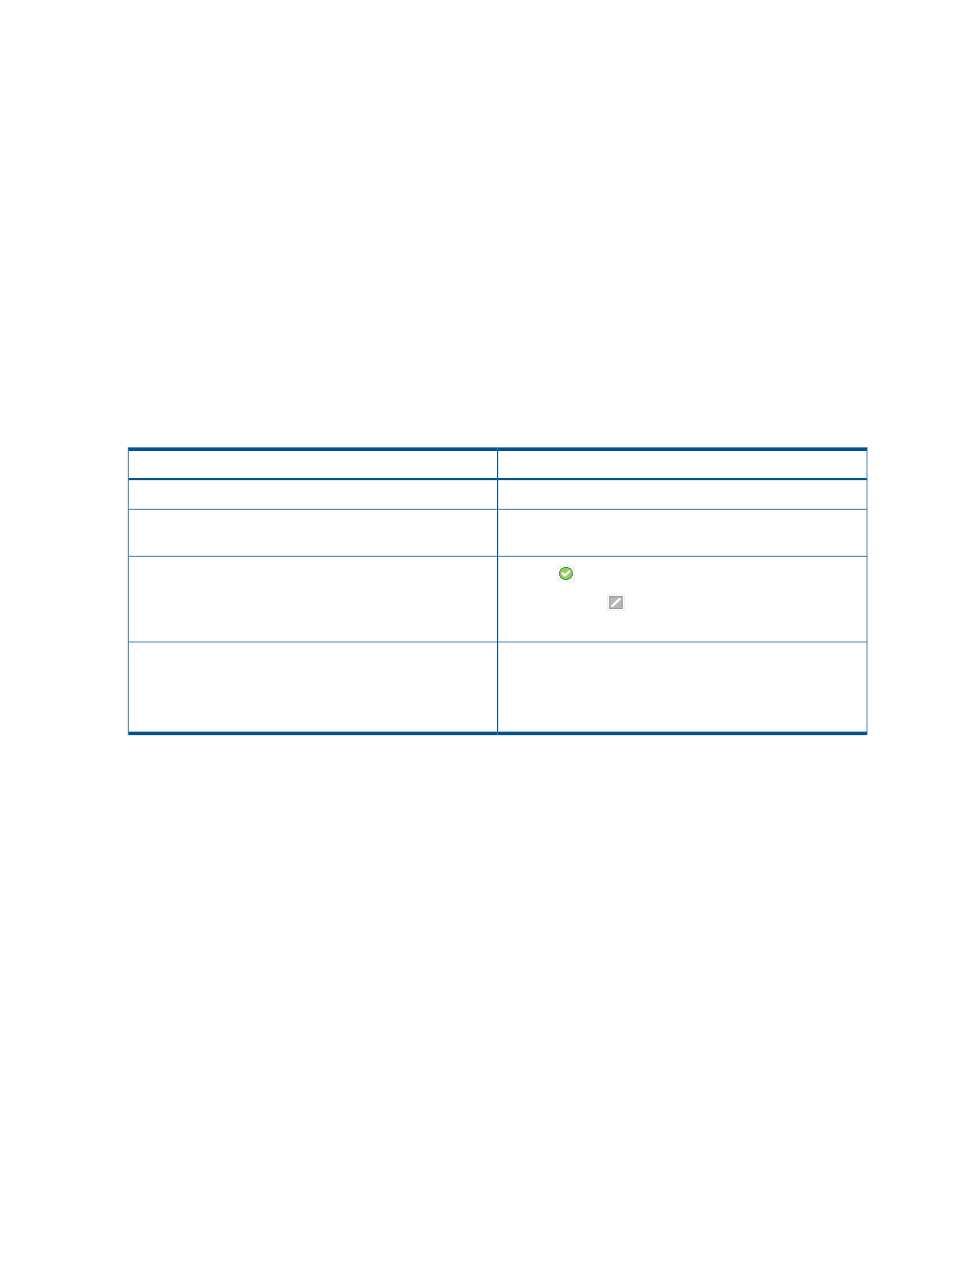
The new schedule starts automatically. The following table provides the subsequent changes that
occur in the Performance Data section for the selected XP or the P9000 disk array record.
Description
Screen elements
Displays the new schedule name.
Schedule Name
Displays the selected components. Click View to see the
corresponding schedule details.
Components
Displays
, which indicates that the schedule has started.
Enabled
Initially, displays
when a schedule is not yet configured
or stopped.
Displays the selected frequency for the DKC, RAID groups,
and the port data collection.
Frequency
Initially, displays 0,0,0 when a schedule is not yet
configured.
When the performance data collection is in progress, you can perform the following functions.
Allow HP XP P9000 Performance Advisor to complete at least two performance data collection
cycles before you proceed with the following tasks. This is to ensure that sufficient data is available
that can be projected on the respective screens:
•
View a graphical representation of the performance of components for different metrics and
duration that you specify. For more information, see
•
View the performance summary of components on the Array View screen. For more information,
see
“Viewing performance summary” (page 175)
•
Configure alarms on components, so that HP XP P9000 Performance Advisor can send
appropriate alarm notifications. For more information, see
.
•
Create custom groups for a set of LDEVs that you want to frequently monitor. For more
information, see
“Creating custom groups” (page 84)
•
Create and schedule reports to view the performance data of components for different metrics,
and duration that you specify. For more information, see
“Generating, saving, or scheduling
.
In case of performance data collection failures, the appropriate failure messages are displayed
on the Event Log screen. HP XP P9000 Performance Advisor can also dispatch email notification
about the collection failure to the intended recipient. To receive performance data collection failure
64
Collecting configuration and performance data
