Dashboard busiest consumers, Dashboard busiest, Dashboard – HP XP Performance Advisor Software User Manual
Page 112

Related Topics
•
“XP/P9000 array health” (page 106)
•
“Dashboard busiest consumers” (page 112)
•
•
“High watermark in dashboard charts” (page 114)
•
Dashboard busiest consumers
You can view the maximum X busiest consumers associated with the selected frontend, cache,
backend, or the MP blade components in the Component Information section. For more information
on specifying the busiest consumer settings, see
“Specifying the top 20 consumers” (page 101)
.
IMPORTANT:
At a time, you can view the maximum X busiest consumers for only one frontend,
backend, or MP blade record that you select in the Statistics section.
To view the maximum X busiest consumers:
1.
Based on your requirement, select a record corresponding to a port, RAID group, or an MP
blade in the respective Frontend, Backend, or the MP Blade Statistics section.
2.
Click Show Consumers.
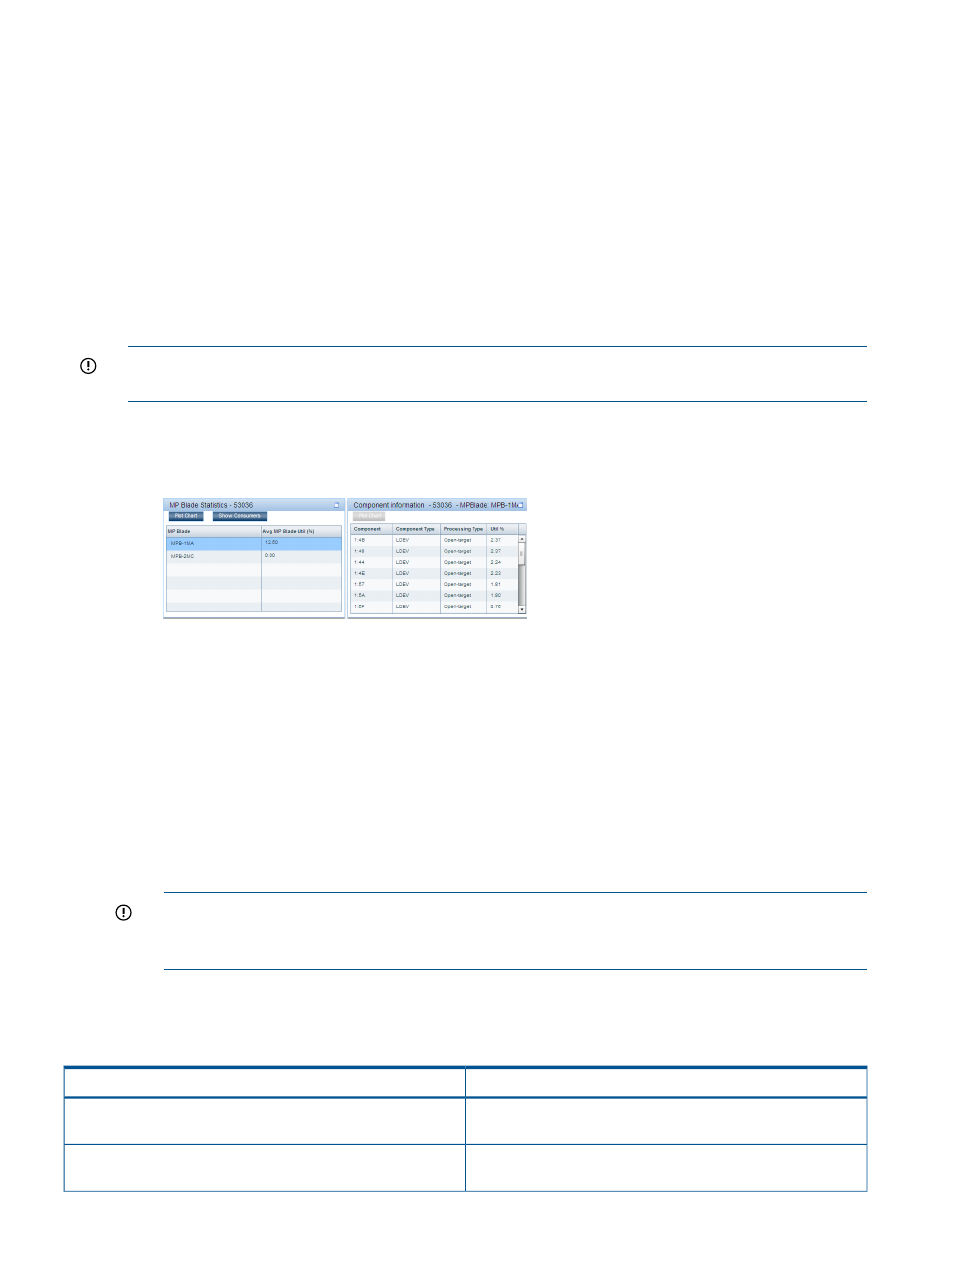
The maximum X busiest consumers are displayed in the Components Information section. The
records are also sorted in the ascending or the descending order as specified on the Threshold
Setting screen.
The above image shows the MP blade record selected in the MP Blade Statistics section and
the corresponding set of consumers displayed in the Component Information section. The
selected MP blade ID is also displayed in the Component Information section title. Similarly,
if you select a RAID group record in the Backend Statistics section, the RAID group # is
displayed in the Component Information section title. In addition, if you select a port record
in the Frontend Statistics section, the port type is displayed along with the port ID in the
Components Information section title.
IMPORTANT:
If the LDEV data collected for the XP or the P9000 disk array configurations
involves 64K or higher number of LDEVs, the response time to display the most and least X
busiest LDEVs may be in the range of 1 to 5 minutes.
The following table displays the cu:ldev ID of the LDEVs associated with the selected RAID group
or the port for an XP disk array. In addition, the corresponding RAID group or the port usage
appears for the following set of metrics.
Description
Metrics
The average latency for reads or writes on the LDEV during the
specified threshold duration.
Avg Read/Write Response Time (ms)
The frontend I/Os on the LDEV during the specified threshold
duration.
IOPS
112
Monitoring performance of XP and P9000 disk arrays
