Trend plot, Getting here – Watlow ANASCAN User Manual
Page 55
ANASCAN User’s Guide 47
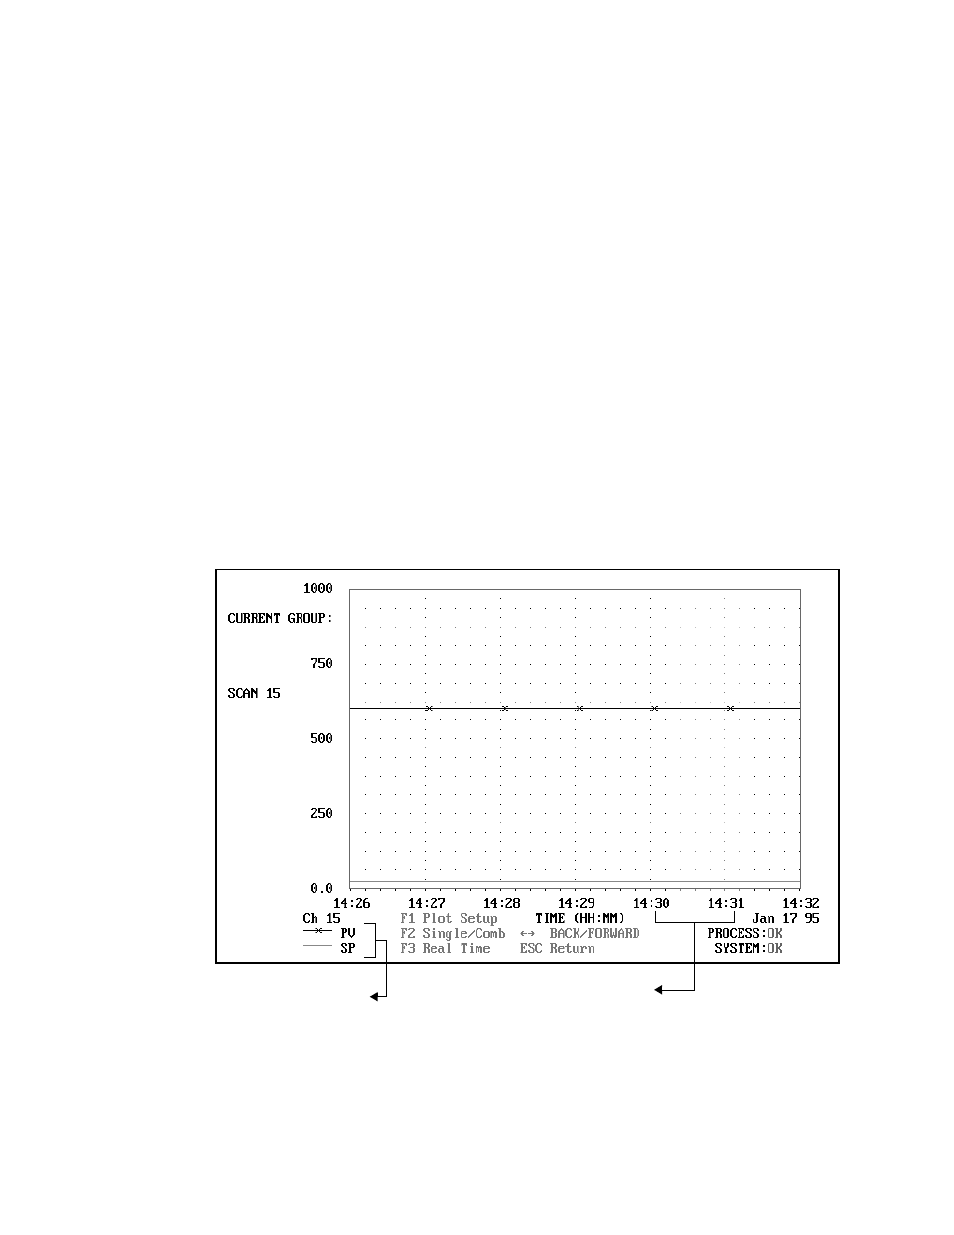
TREND PLOT
The Trend Plot screen offers graphic trending for both real time and past
history of up to 48 hours. Two parameters can be plotted: process
variable and setpoint. You can use any combination of these values.
You can also combine channels, and plot up to three different channels
at the same time.
The screen is a combination of past and real time trend plotting. The
past is on the left 5/6 of the screen and the real time is on the right 1/6.
If an EGA video card is installed in the computer, the screen will be
colored for easier identification. If a CGA video card is installed, the
plot will be displayed in black and white only.
Getting Here
Press F7 from the Overview screen or the Channel Setup screen.
A legend for the
parameters being
plotted
One segment out of six in the time
scale. Set in minutes or hours.
- 12LS Controller (111 pages)
- 8LS Controller (140 pages)
- 8PID Controller (55 pages)
- Addendum to EZwarePlus (50 pages)
- ANASOFT (95 pages)
- ANAWIN 2 (154 pages)
- ANAWIN 3 (23 pages)
- Calibrating Watlow Series 988 Family Process Controls (19 pages)
- CAS (98 pages)
- CAS200 (124 pages)
- CLS (180 pages)
- CLS200 (251 pages)
- CLS200, MLS300 and CAS200 (92 pages)
- Control Console (12 pages)
- CPC400 (230 pages)
- DIN-A-MITE Style A (9 pages)
- DIN-A-MITE Style B (14 pages)
- DIN-A-MITE Style C (22 pages)
- DIN-A-MITE Style D (9 pages)
- DIN-Mount Adapter Instruction Sheet, Rev A (1 page)
- Dual DAC (4 pages)
- EM Gateway (28 pages)
- E-Safe Hybrid Relay Rev B (4 pages)
- E-SAFE II Hybrid Power Switch (4 pages)
- EZwarePlus Programming (264 pages)
- EZ-ZONE PM (111 pages)
- EZ-ZONE PM PID (125 pages)
- EZ-ZONE PM Express Limit (34 pages)
- EZ-ZONE PM Express (35 pages)
- EZ-ZONE PM Integrated Controller (181 pages)
- EZ-ZONE RM Limit Module Rev C (127 pages)
- EZ-ZONE RMA Modul (79 pages)
- EZ-ZONE RMC (236 pages)
- EZ-ZONE RME (124 pages)
- EZ-ZONE RMH (161 pages)
- EZ-ZONE RUI/Gateway (62 pages)
- EZ-ZONE RM-Scanner-Modul (140 pages)
- EZ-ZONE ST (97 pages)
- F4 External Event Board - Rev.B (2 pages)
- HG Series Mercury Displacement Relay (6 pages)
- LogicPro (296 pages)
- Mercury Relay or MDR Retrofit (13 pages)
- MICRODIN (24 pages)
- MICRODIN (106 pages)