Track and trend, View track, Track vs. trend – Teledyne LeCroy HDO6000 Operators Manual User Manual
Page 93
Operator's Manual
Track and Trend
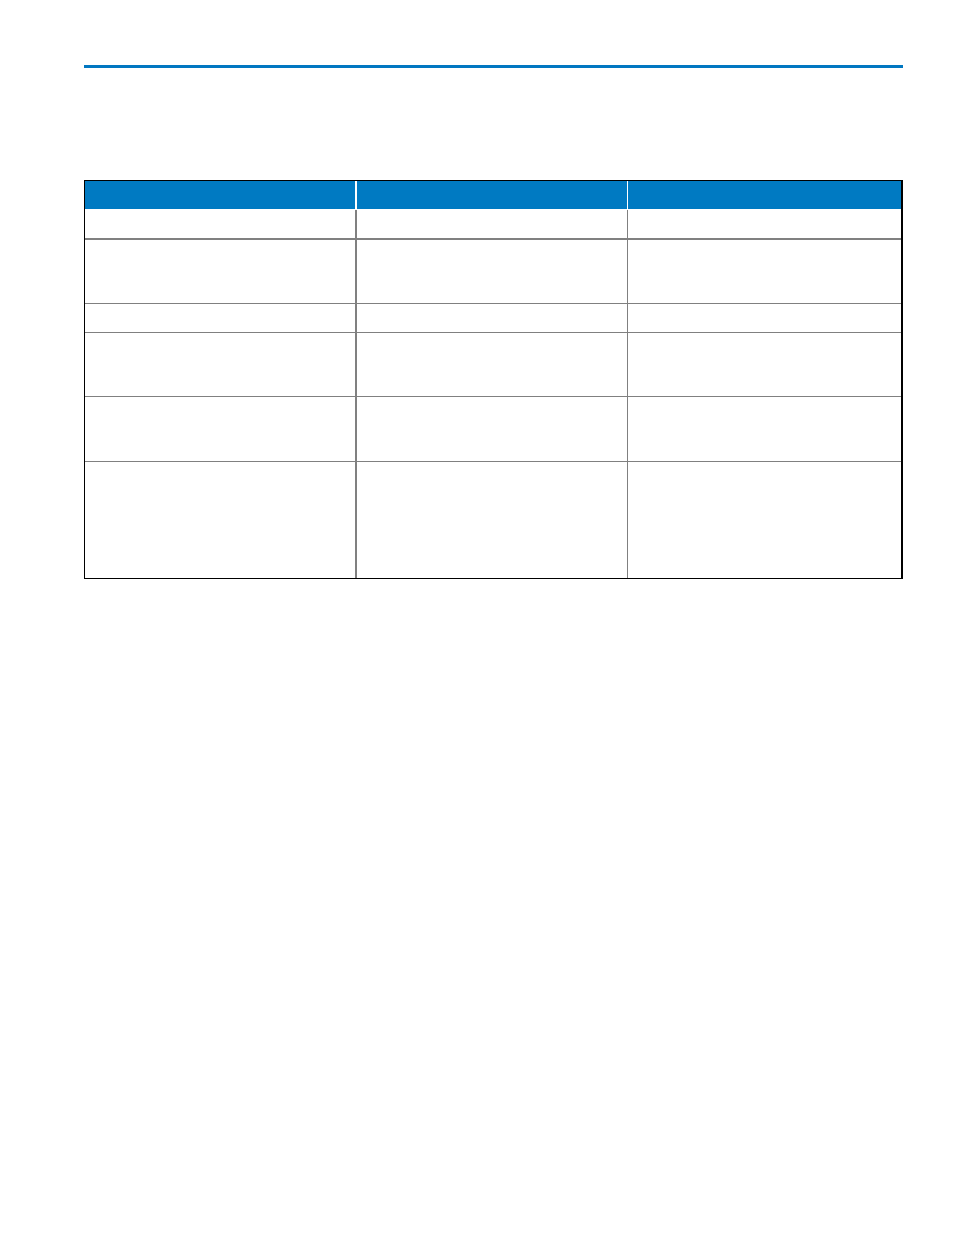
Both Track and Trend are tools that can be used to plot measurement data and observe variations with
respect to time. Differences between Track and Trend are summarized in the following table:
Characteristic
Track
Trend
Representation
Parameter value vs. time
Parameter value vs. event
Behavior
Non-cumulative (resets after every
acquisition). Unlimited number of
events
Cumulative over several acquisitions
up to 1 million events
Time Correlation to Other Data
Yes
No
Monitors an Evolution in the
Frequency Domain
Yes
No. Trend points are not evenly
spaced in time and therefore cannot be
used for an FFT.
Monitors the Evolution of a
Measurement Parameter over Several
Acquisitions
No. Track resets after every
acquisition.
Yes
Ensures No Lost Measurement Data
Yes. Maximum time period that can be
captured is limited by acquisition
memory and sampling rate.
No. Since data can be accumulated
over many acquisitions, and since the
oscilloscope takes time to calculate
measurement values and to display
data before the trigger is re-armed,
data can be missed.
In general, Track is the tool to use if you want to capture a continuous stream of data spaced closely
together. To understand the change in a parameter with time, Trend can be used if your data is spaced
widely apart and longer than the dead-time of the oscilloscope between acquisitions. Think of Trend as a
strip chart recorder for your oscilloscope.
View Track
This procedure explains how to view the Track of a measurement parameter applied to a waveform. A
track is a waveform composed of parameter measurements that is time synchronous with the source
waveform. The vertical units are those of the source parameter and the horizontal units are seconds. In
order to maintain time synchronism, the parameter values are posted at the sampling rate. Track values
are redundant in that the same value is repeated every sample period until the measurement changes.
Although a Track plots measurement parameter values, it is created as a function and controlled on the
Math dialog.
1. If not already on the Measurement dialog, choose Measure → Measure Setup....
2. Touch the Px tab for the parameter you wish to plot.
3. Touch the Track button at the bottom of the Px dialog and select a math function (Fx) in which to draw
the Track.
The Track is displayed on a new grid, along with its function descriptor box.
4. To rescale the Track plot:
l
Touch the Track function descriptor box to open the Fx dialog, then touch the Track tab.
922499 Rev B
85