Sample volume, Sample dilution, Reagents – Luminex xPONENT 3.1 Rev 2 User Manual
Page 18: Gating, Sample volume sample dilution reagents gating
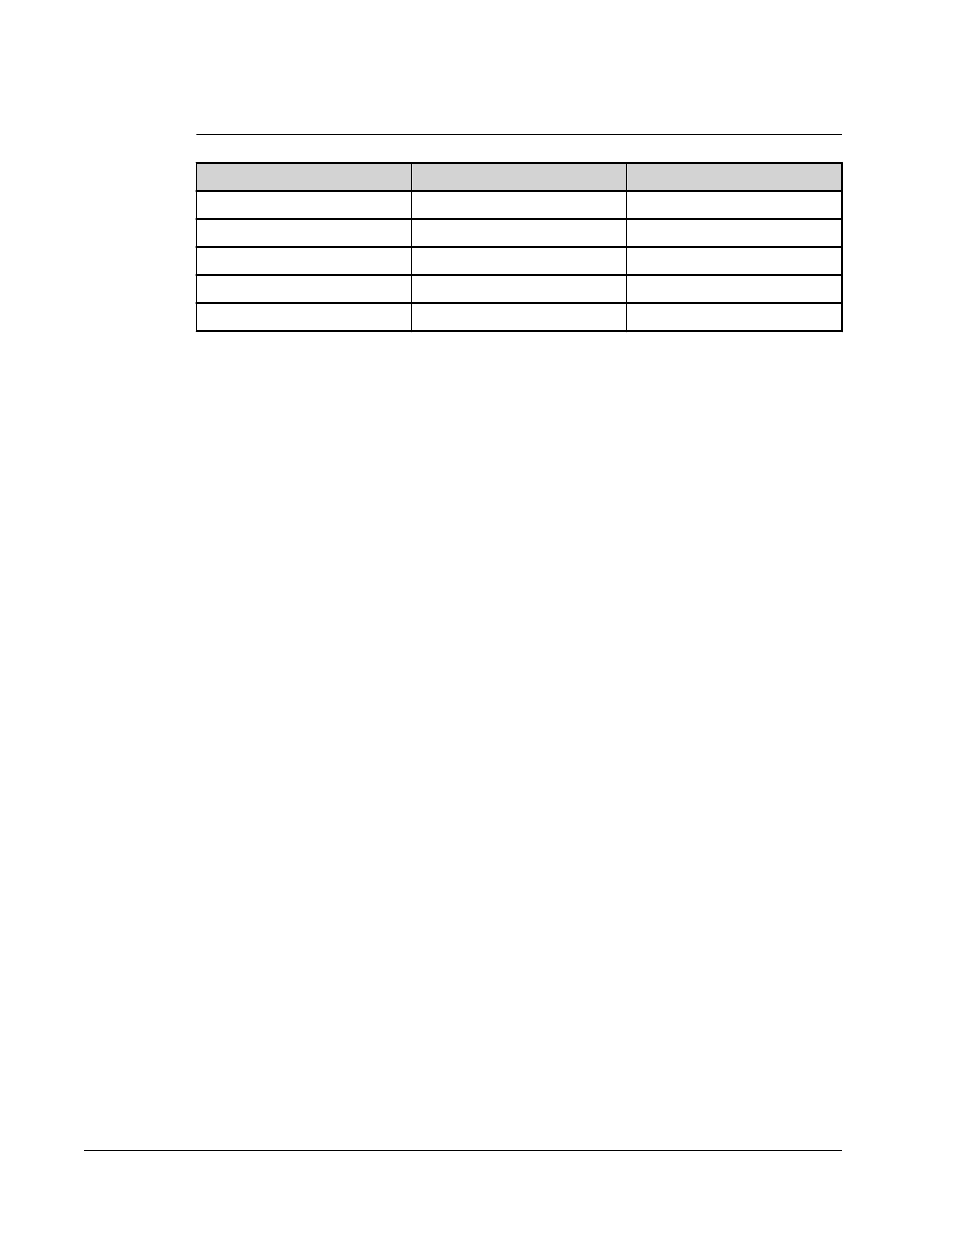
TABLE 2.
Reporter Fluorchromes Wavelengths
R-Phycoerythrin
Alexa 532
Formula weight (Daltons)
240,000
470
Absorbance max (nm)
480, 546, 565
531
Extinction max (M-1cm-1)
1,960,000
83,800
Emission max (nm)
578
554
Quantum yield
0.82
0.8
Sample Volume
Sample volumes or sample sizes range from 10 to 200 µL. Ensure that some sample remains
in the well after aspiration; about 25 µL greater than the sample volume. This amount may
vary depending on the type of plate used. After acquisition, the Luminex analyzer washes the
sample lines resulting in ejection of approximately 165 µL of sheath fluid back into the well for
a 96-well plate. Ensure that there is room to add this amount to the well without overflowing
and contaminating other wells.
The volume restrictions on the assay design can be expounded by the following formula:
Total well volume (µL) – Sample uptake volume (µL) + 165 (µL) • Total well volume = Starting sample volume of a well before the unit samples for acquisition. Well volume is determined by the consistency of the bead set. • Sample uptake volume = Uptake volume for acquisition (program this in the protocol as sample volume). • 165 (µL) = Volume expelled back as stated in the above paragraph. • Maximum well volume plate = The maximum volume capacity of the wells in a selected 96- well microtiter plate. Sample Dilution Dilute concentrated biological samples such as plasma or serum, at least 1:5 with reagents Reagents Formulated reagents must be free of particulates other than xMAP beads. Do not dilute Gating Gate positions are dependent upon buffer composition. Any changes made to the buffer Determine the gating on the Doublet Discriminator channel for the assay during assay Introduction 5
as part of assay setup or as a final dilution step. If running an xMAP-based kit, follow the
dilution instructions in the kit’s product insert.
xMAP calibrators or verifiers.
composition in an assay may result in a different optimal gate location.
development. The numeric values appear on the left side of the histogram. Use the numerical
gate position, as determined during assay development, to set the gate location in the
protocol.