View itap traffic statistics – Net Optics iTap 10 GigaBit Port Aggregator User Manual
Page 34
iTap 10 GigaBit Port Aggregator
30
If a link is down, check the cables and power supplies, and make sure the device
on the other end of the link is functioning properly.
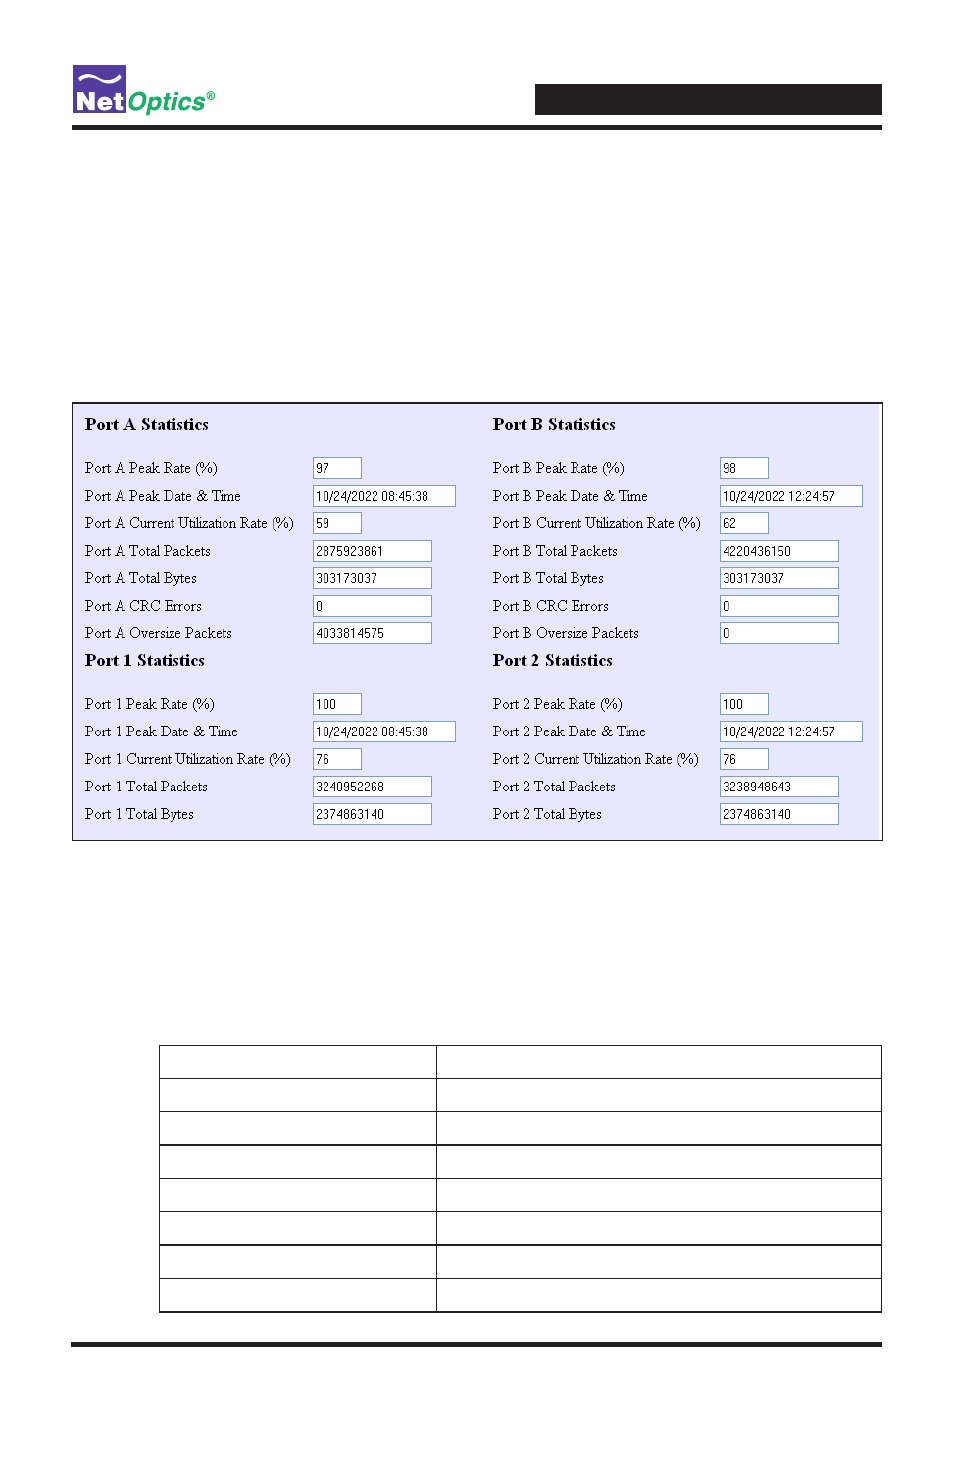
View iTap Traffic Statistics
Web Manager displays iTap traffic statistics for both Network Ports and both Monitor
Ports. The statistics for the Network Ports apply to traffic received into the port.
The statistics for the Monitor Ports apply to traffic transmitted out of the port.
Figure 14: iTap Network and Monitor Port Statistics (middle part of Web Manager page)
The iTap Port Aggregator periodically sends updated statistics to Web Manager. The
statistics can also be updated by refreshing your browser. All counters reflect counts
since the last statistics reset; they are 32-bit counters that roll over from their maximum
count (approximately 4.3 billion) to 0, which may happen frequently for the Total Bytes
count. The following table defines the traffic statistics available from Web Manager.
Field Name
Description
Peak Rate (%)
Highest utilization since last reset
Peak Date & Time
When the peak occurred
Current Utilization Rate (%)
Utilization level of the port bandwidth
Total Packets
Total packets received
Total Bytes
Total bytes received
CRC Errors
Number of CRC errors
Oversize Packets
Number of oversize packets