2 × 12a digital dual microdlynx, Non-isolated dc-dc power modules, Datasheet – GE Industrial Solutions 2 × 12A Digital Dual Output MicroDLynx User Manual
Page 7: Characteristic curves
GE
Datasheet
2 × 12A Digital Dual MicroDlynx
TM
: Non-Isolated DC-DC Power Modules
4.5Vdc –14.4Vdc input; 0.51Vdc to 5.5Vdc output; 2 × 12A Output Current
February 14, 2014
©2014 General Electric Corporation. All rights reserved.
Page 7
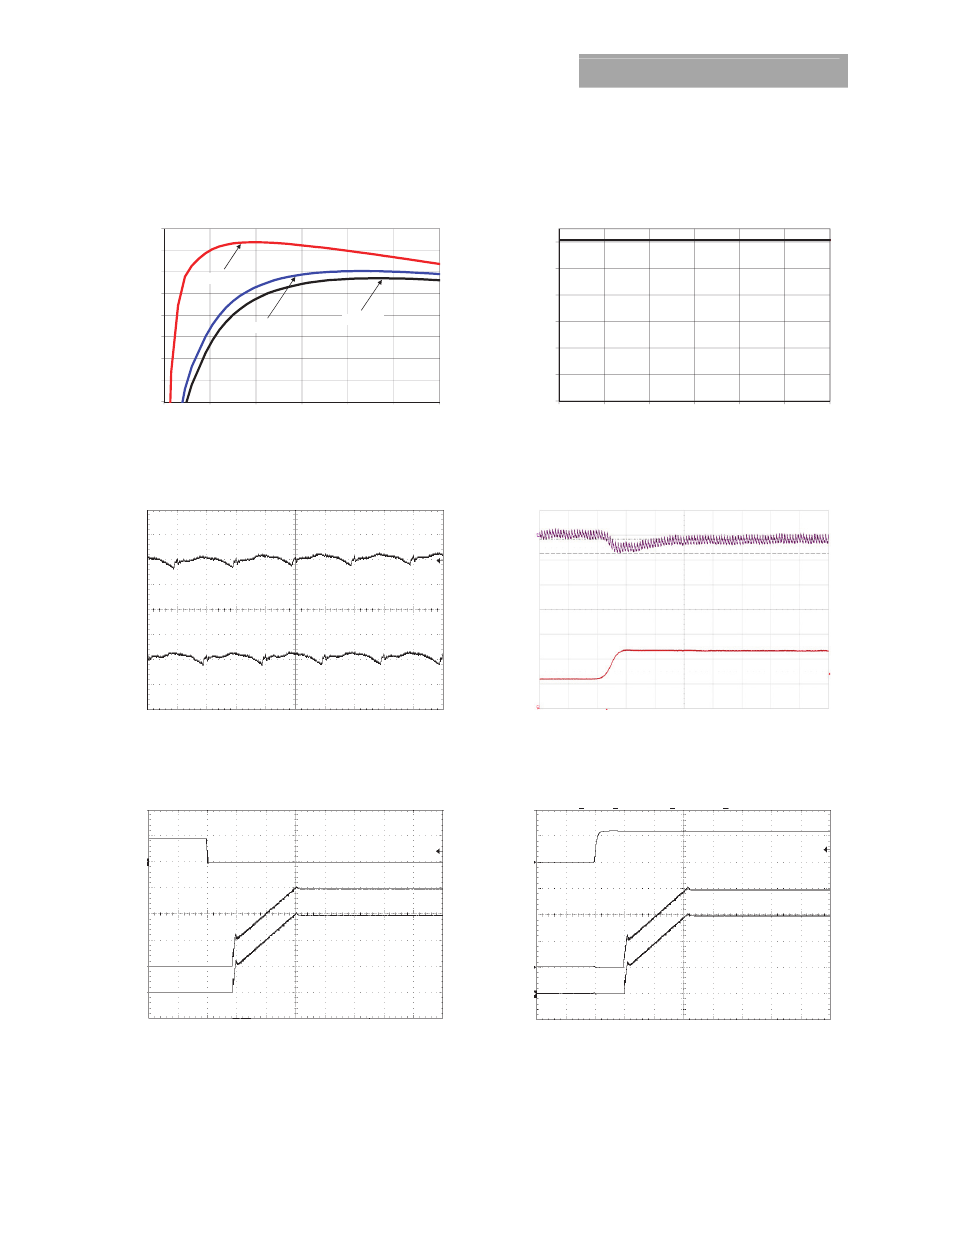
Characteristic Curves
The following figures provide typical characteristics for the 2 × 12A Digital Dual MicroDlynx
TM
at 0.6Vo and 25
o
C.
EFFI
CI
EN
CY
, η
(%
)
OUTPUT
CU
RRENT, Io
(A
)
OUTPUT CURRENT, I
O
(A)
AMBIENT TEMPERATURE, T
A
O
C
Figure 1. Converter Efficiency versus Output Current.
Figure 2. Derating Output Current versus Ambient
Temperature and Airflow.
OU
TP
U
T V
O
LT
AG
ES
V
O
(V
) (3
0m
V/
di
v)
O
U
TPU
T
CU
RR
EN
T,
O
U
TP
UT
VO
LT
AG
E
I
O
(A
) (
5A
di
v)
V
O
(20m
V/
di
v)
TIME, t (1
μs/div)
TIME, t (20
μs /div)
Figure 3. Typical output ripple and noise (C
O
=
2×0.1uF+2×47uF ceramic, V
IN
= 12V, I
o
= I
o1,max,
I
o2,max,
).
Figure 4. Transient Response to Dynamic Load Change from
50% to 100% on one output at 12Vin,
Cout=2x47uF+7x330uF, CTune=12nF, RTune=300Ω
OUT
PU
T V
O
LT
AG
ES
O
N
/O
FF
V
O
LT
AG
E
V
O
(V
) (200mV/div
)
V
ON/OFF
(V
) (
5V
/d
iv
)
O
U
TPU
T
VO
LTA
G
ES
IN
PU
T
VO
LT
AG
E
V
O
(V
) (200
mV/
di
v)
V
IN
(V
) (10
V/div)
TIME, t (2ms/div)
TIME, t (2ms/div)
Figure 5. Typical Start-up Using On/Off Voltage (Vin=12V, I
o
=
I
o1,max,
I
o2,max,
).
Figure 6. Typical Start-up Using Input Voltage (V
IN
= 12V, I
o
=
I
o1,max,
I
o2,max,
).
50
55
60
65
70
75
80
85
90
2x0
2x2
2x4
2x6
2x8
2x10
2x12
Vin=4.5V
Vin=14V
Vin=12V
0
2
4
6
8
10
12
55
60
65
70
75
80
85
Derating curve applies
to Both Outputs