Description of the web interface – B&B Electronics R-SeeNet-5 - Manual User Manual
Page 39
4. DESCRIPTION OF THE WEB INTERFACE
32
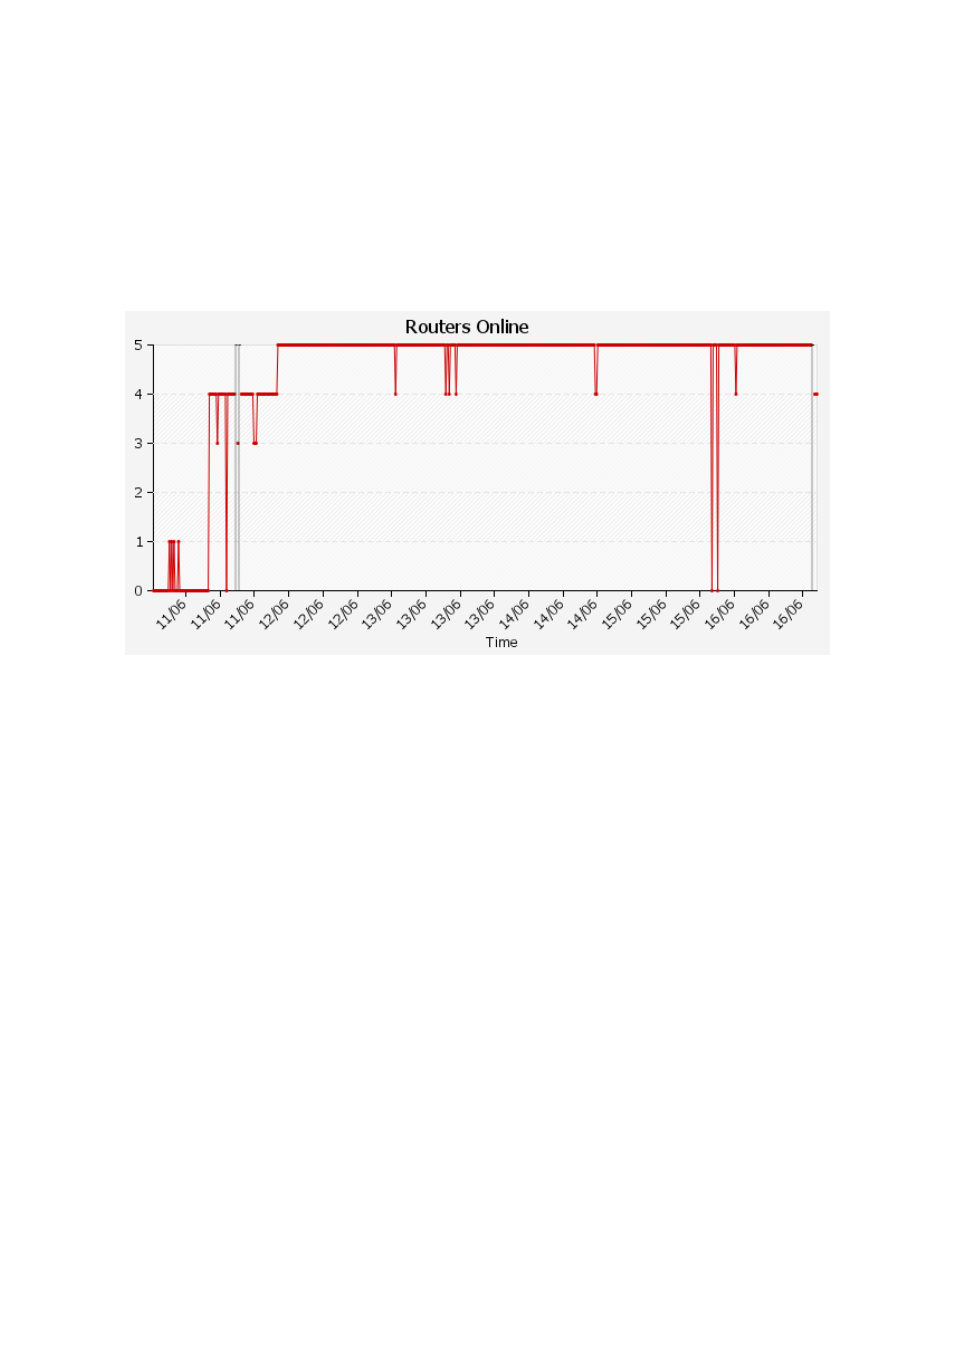
4.5.5 Routers Online
The Routers Online page informs about the number of online routers. There is displayed
maximum and minimum value. The following graph shows the number of online routers in
stretches of time that are tailored to the chosen period.
Figure 46: Routers online graph
4.5.6 All
Click on the All subpage to display all available statistics within the selected period on a
single page.
4.5.7 Daily Report
The Daily Report page displays statistics relating to the number of online routers, routers
availability, latency and packet loss. Statistical data refer to the previous day. At the beginning
of this page is the following information:
• Online network access routers – Number of online routers
• Average availability over period – Average availability of monitored routers
• Average Latency over period – Average latency of monitored routers
• Average packet loss over period – Average packet loss of monitored routers
Then there are displayed four graphs relating to the above properties.