Description of the web interface – B&B Electronics R-SeeNet-5 - Manual User Manual
Page 30
23
4. DESCRIPTION OF THE WEB INTERFACE
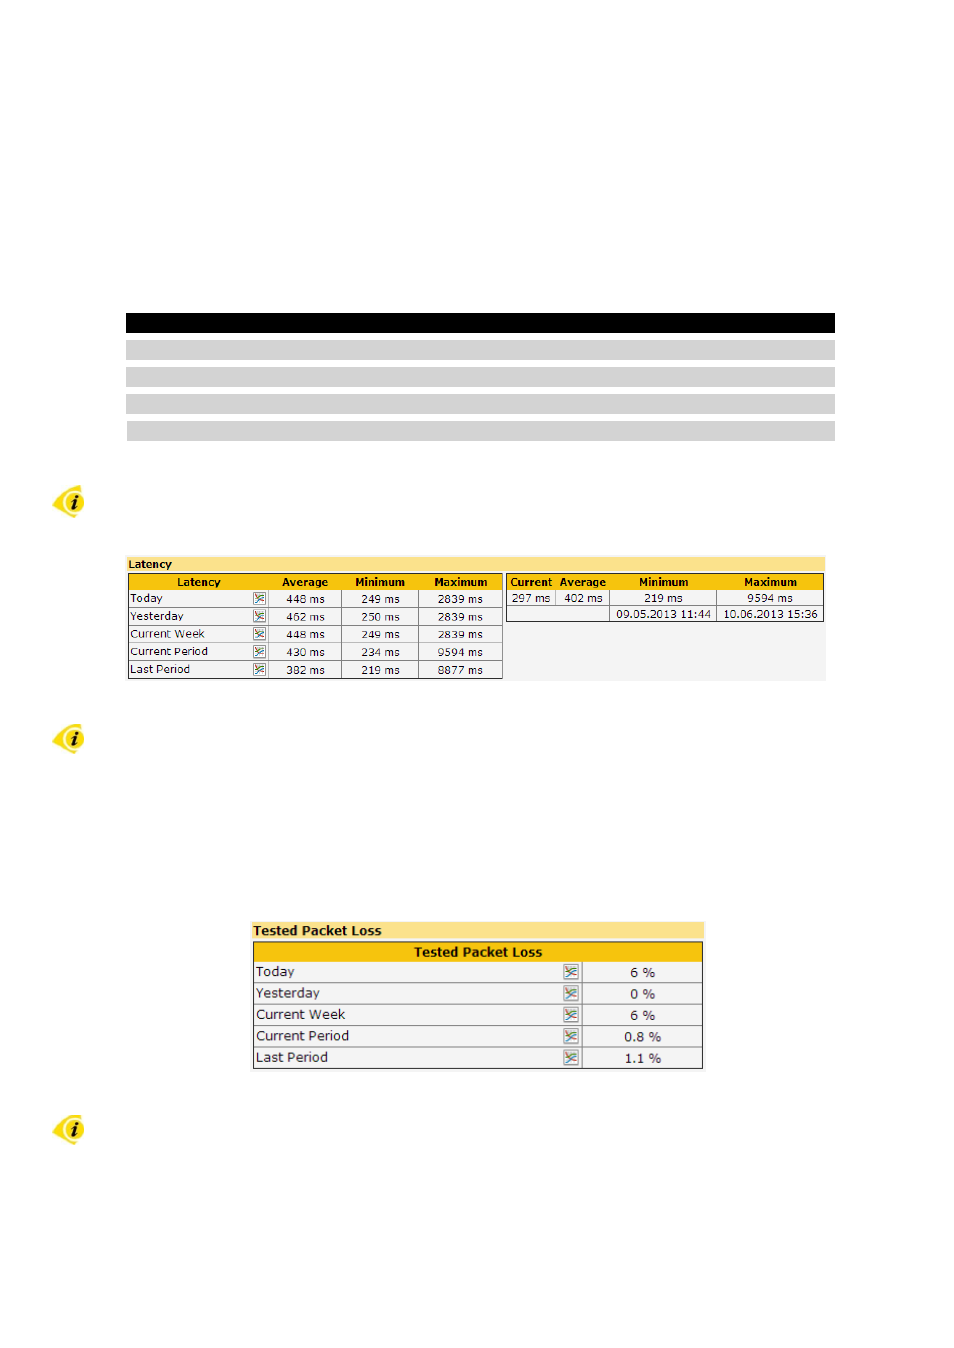
Latency
The Latency part displays latency statistics for a certain period (today, yesterday, this and
last week, this and last month) for both SIM cards. The third table contains information about
the minimum and maximum latency with time when it occurred.
Column
Description
Latency
Period for which data are displayed
Average
Average latency
Minimum
Minimum latency
Maximum
Maximum latency
Table 9: Latency
Latency is determined from a ping, which is sent by a core of monitoring system to the
individual routers during reading.
Figure 28: Latency
Further it is possible to see a graph with the course of latency in a certain period by
pressing the graph image in a cell with the name of the selected period.
Tested Packet Loss
The Tested Packet Loss part displays lost packets statistics for a certain period. The value
of packet loss rate is the ratio of lost packets to all packets sent during reading router by a core
of monitoring system.
Figure 29: Tested Packet Loss
Further it is possible to see a graph with the course of packet loss in a certain period by
pressing the graph image in a cell with the name of the selected period.