Description of the web interface – B&B Electronics R-SeeNet-5 - Manual User Manual
Page 28
21
4. DESCRIPTION OF THE WEB INTERFACE
4.3.2 Stats
This subpage displays information and statistics about the selected router in five separate
blocks
– Traffic, Signal Strength, Latency, Tested Packet Loss and Router Availability.
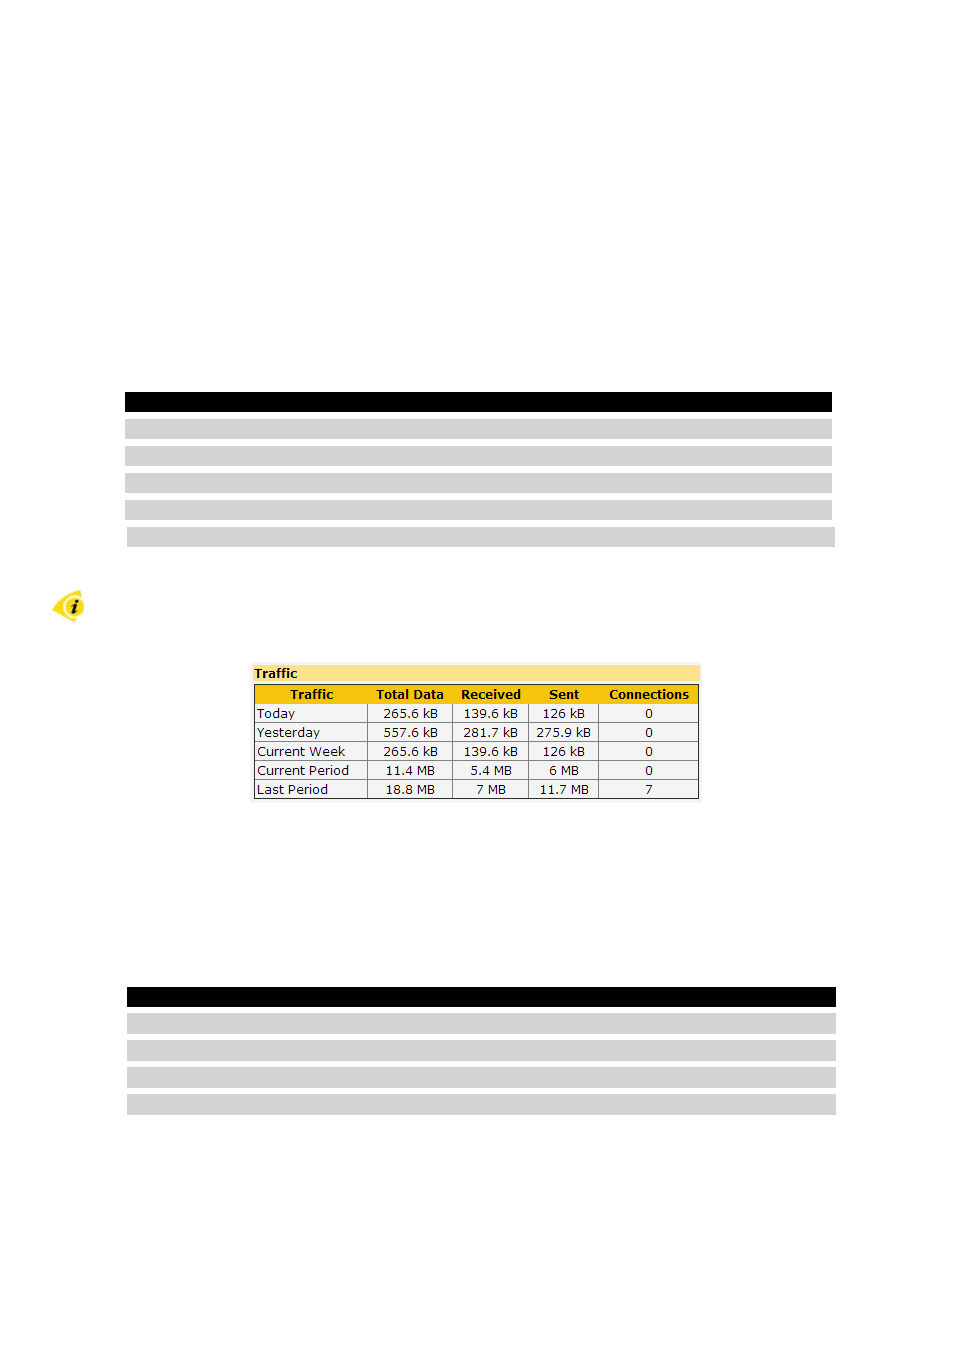
Traffic
Traffic section displays the statistics of data transmitted and the number of established
PPP connections for both primary and secondary SIM card.
Column
Description
Traffic
Period for which data are displayed
Total data
Size of data transmitted in this period
Received
Size of data received in this period
Sent
Size of data sent in this period
Connections
Number of established PPP connections in this period
Table 7: Traffic
If the number of established PPP connections in the period is equal to zero, the router
didn
’t lose a PPP connection in the period.
Figure 25: Traffic
Signal Strength
The Signal Strength part displays signal strength statistics for a certain period (today, yes-
terday, this and last week, this and last month) for both SIM cards. The third table contains
information about the minimum and maximum signal strength with time when it occurred.
Column
Description
Signal Strength
Period for which data are displayed
Average
Average signal strength
Minimum
Minimum signal strength
Maximum
Maximum signal strength
Continued on next page