Sensor information, View log button – Wavetronix Command Collector (CMD-DCx) - User Guide User Manual
Page 54

CHAPTER 5 • SENSOR CONFIGURATION PAGE
53
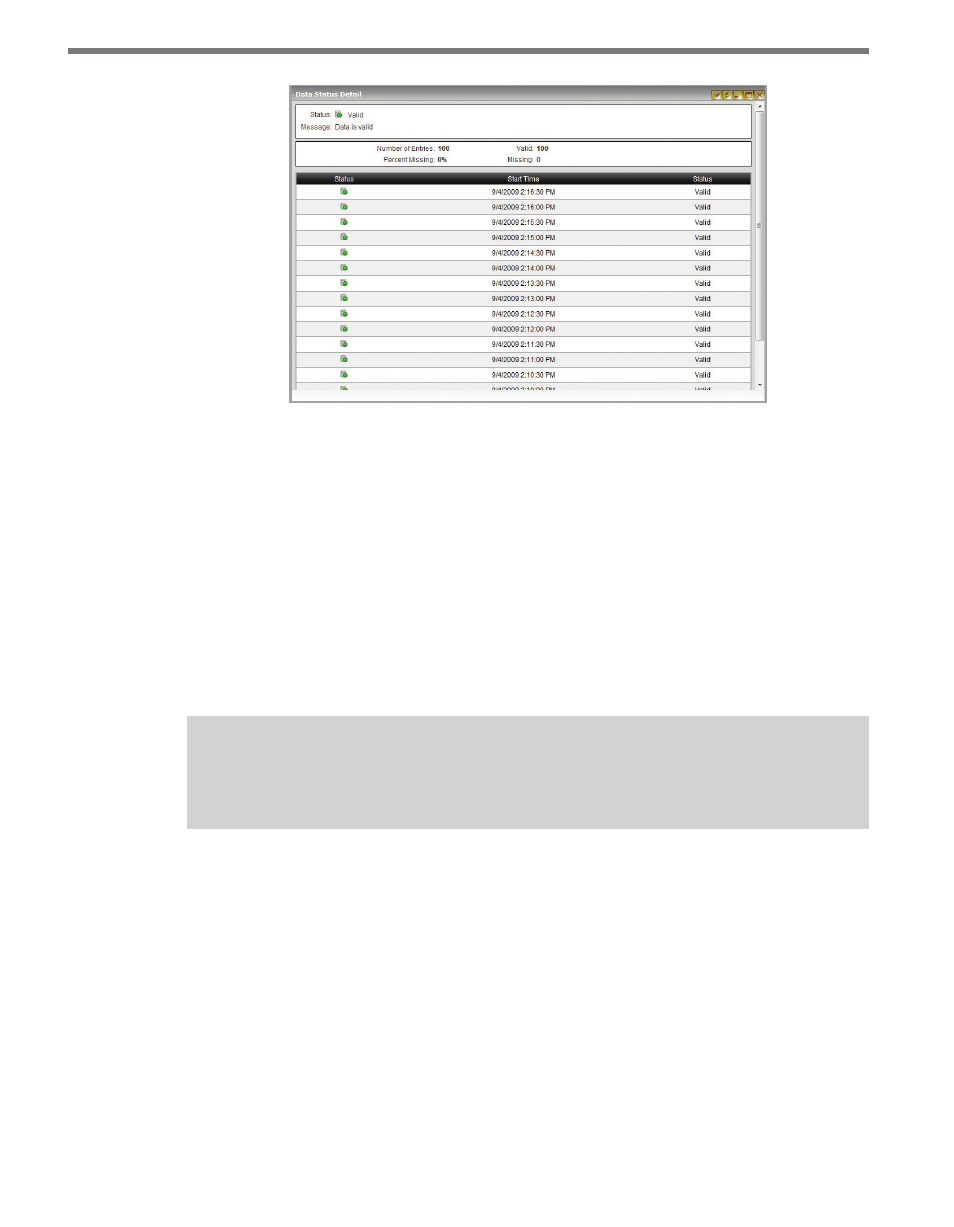
Figure 5.4 – Data Status Detail
It is possible for communication to be 100% and for data to still be missing, but using the
data status information will be useful in troubleshooting. Internally, Collector fills in data
gaps by tracking which times have been successfully collected and which are still missing.
This tracking occurs as soon as the sensor is added to Collector.
The graph can be interpreted using the following information:
˽
Navy indicates the data is present.
˽
Gray indicates the data is missing.
˽
White indicates that the oldest time being tracked is less than 100 interval periods in
length.
Note
Use the the Data Validation Report to see what data is actually in the database.
Sensor Information
The sensor information section of the Sensor Info bar contains the sensor type, description
and location. This information is read directly from the sensor and is therefore uneditable.
However, depending on the sensor type, you may need to enter this information in the
Sensor Config page. You can choose what sensor information to display by using the Select
Sensor to Display menu (see the Select Sensor to Display Menu section below).
View Log Button
The View Log button takes you to the Sensor Error Log page, which will display the recent
communication/collection errors for the sensor.
