Service aware screen, Service aware screen -44 – Verilink WANsuite 7205 (34-00317.B) Product Manual User Manual
Page 74

3-44
W A N s u i t e 7 2 0 5
There are ninety-six 15-minute buckets (sampled every second) available for
DLCI statistics. If the unit is powered on at 01:00 PM, the first interval will
be completed at 01:15 PM; subsequent intervals would be completed at xx:30,
xx:45, xx:00 and xx:15. Interval 1 is always the latest (most recent) interval,
and interval 96 will always be the oldest.
The first table of the DLCI Statistics screen shows a summary that includes
all 96 buckets. You can choose to see statistics for any given bucket by
selecting the desired Period Index from the pull-down menu and clicking the
“Submit” button. Alternatively, you can display all intervals at once by
clicking the “All DLCI Intervals” button beneath the table. The MIB
(ipadv2.mib) describes each available statistic.
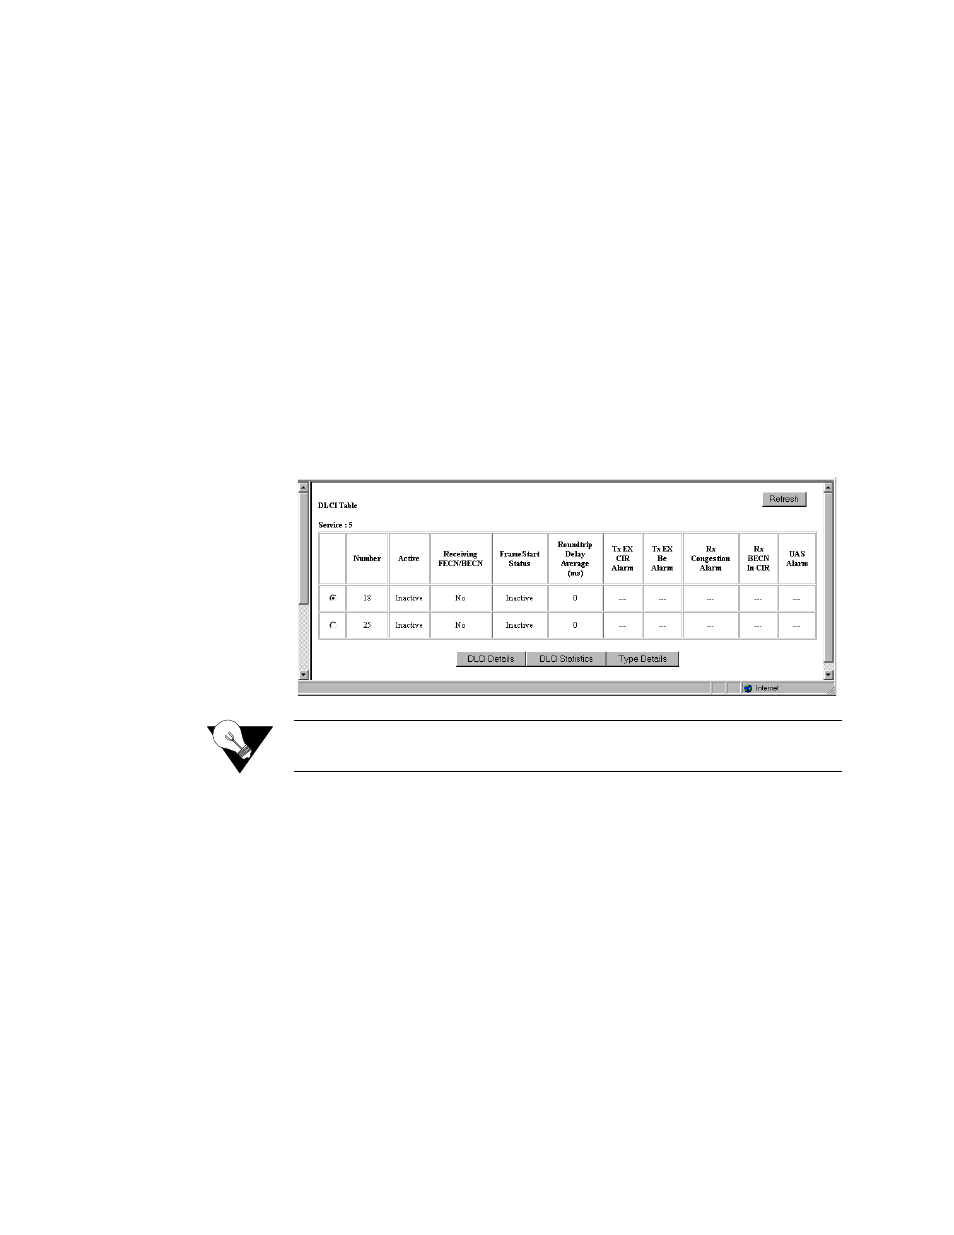
DLCI Table Screen
Clicking the “DLCI Table” button on the DLCI Details screen will display a
table of all DLCIs on a specific Frame Relay service along with their state
and alarm conditions.
Figure 3.34
DLCI Table Screen
NOTICE:
The DLCI Table and DLCI Details screens are available from both the
Endpoint Table and the Frame Relay Service Details screens.
Service Aware Screen
The Service Aware function recognizes IP traffic and counts the number of
frames and bytes passed for a specific service based on filters by DLCI, by IP
Address, and by IP Port. Each row of the Service Aware table represents a
specific set of filter parameters known as a “rule.” Each rule is established
through the Rule Config screen, which is accessed by clicking the “Rule
Details” button at the bottom of the Service Aware screen.
The Service Aware screen (Figure 3.35) provides a table showing these
filtered packet counts for up to 10 rules. This table indicates which Service
Aware filters are enabled or disabled, and shows the specific DLCI, IP
Address, and IP Port by which the IP traffic is filtered. In addition, this table
shows the Tx Alarm Threshold and the current Tx Alarm status (if enabled)
for each rule.
