Measurement writer, Minimum/maximum display, Trigger – Microsonic LCA-2 User Manual
Page 46

Page 46 of 51
Visualisation of measurements
M
EASUREMENT W RITER
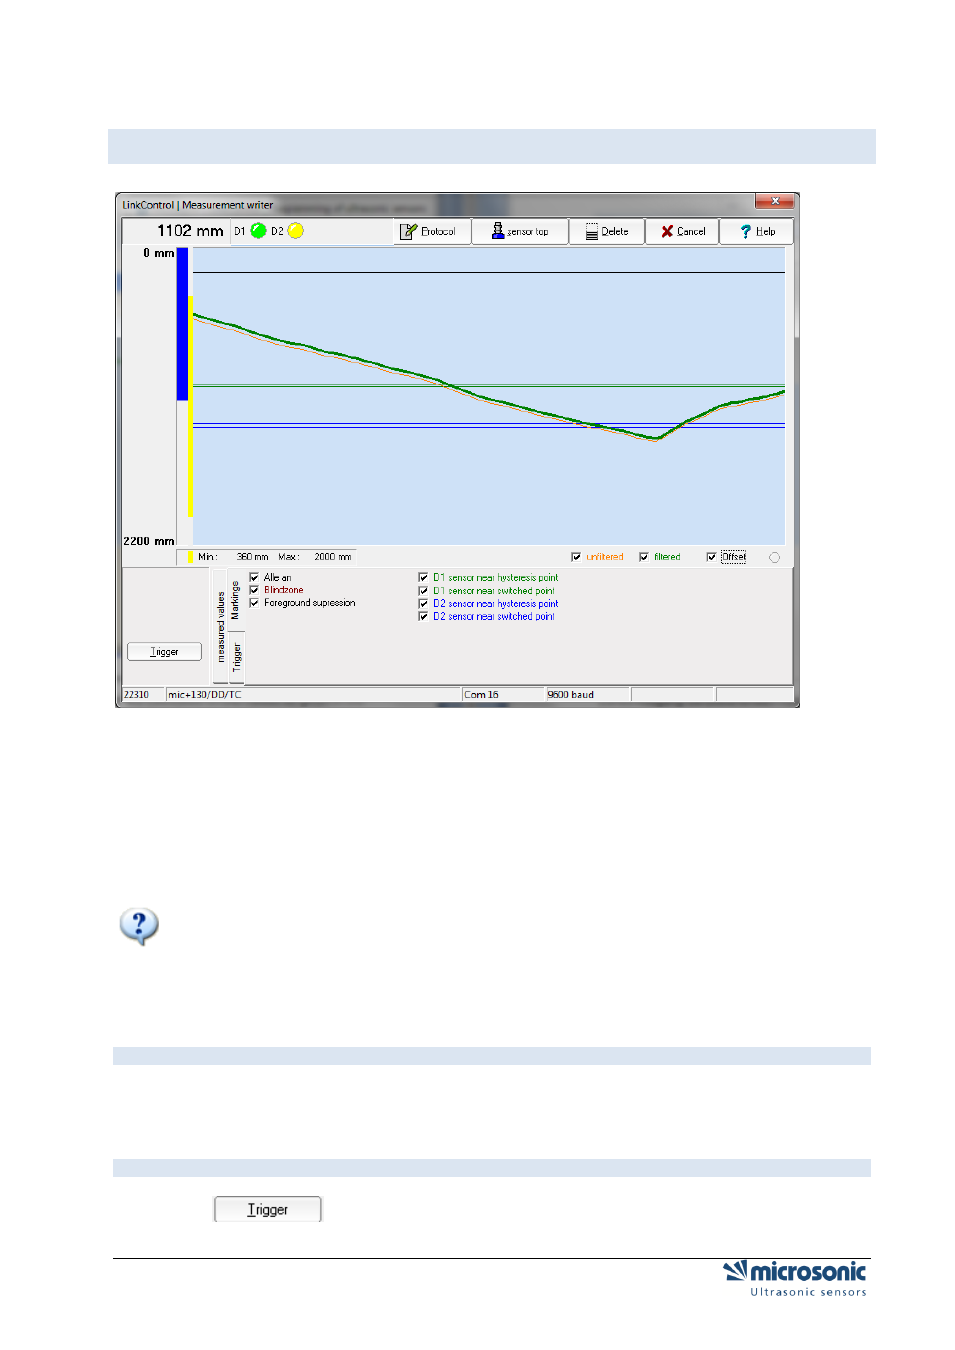
Every measuring value is displayed time continuous like an x-t writer.
The expected output voltage and the expected output current are calculated on the values as given in the
input mask; thus they should match with the actual analogue signal on the sensor output (within the
specified ac-curacy). To have correct results the values in the input masks have to be identical to the
values stored in the sensor!
The LED's D1 and D2 are showing the required state of the switching output S1 and S2, respectively the
analogue output. To have correct results the values in the input masks have to be identical to the values
stored in the sensor.
onlymic+.../TC bzw. mic-...M Sensoren ab 2004 und lpc
Unfiltered (red curve) and filtered measured values (green curve) can be represented simultaneously.
Both measured values are to be fading out. If unfiltered and filtered measured values lie above each
other, one can move the red curve of the unfiltered measured values around some pixels.
M
INIMUM
/
MAXIMUM DISPLAY
Minimum and maximum distance is shown as a yellow bar. With the button Delete you can reset these
values.
T
RIGGER
After click on
you will see aditional settings. The following parameters can be displayed.
